本と投資は人を成長させるをコンセプトにしているブロガー、Youtuber、40代サラリーマン投資家ぐりっとです。
Vの2023年Q1(3月)の配当金が発表されました。
2023年Q1(1月)の配当実績は$0.7862でした。(ブログ内で$0.78と記載しています)
2022年Q1は$0.708200(ブログ内では$0.71と記載)、前年同期比11%増配になりました。
 ぐりっと
ぐりっと期待以上の結果でした
計算方法は以下の通りです。
増配率 = (今期配当金額 – 前期配当金額)/ 前期配当金額 × 100
(0.7862 – 0.7082)/ 0.7082 × 100 = 11.00%


参考サイト
VTI の投資成績を詳しく知りたい人はバンガード社のホームページを参考にしてください。


2023年Q1の成績一覧表 あわせて読みたい


ここからは2023年Q1をこれからも更新していきます。
VTI概要


銘柄名:バンガード・トータル・ストック・マーケットETF(Vanguard Total Stock Market ETF)
銘柄構成数:3500以上
運用会社:バンガード社
設定日:2001年5月24日
経費率:年率0.03%
配当利回り:1.60%(2023/3/26)
ベンチマーク:CRSP USトータルマーケット・インデックス(CRSP US Total Market Index)
・1年トータルリターン:-11.79%(2023/3/26)
・3年トータルリターン:9.98%(2023/3/26)
・5年トータルリターン:19.13%(2023/3/26)
上位101銘柄
| 1 | Apple Inc. | 5.64% |
| 2 | Microsoft Corporation | 4.70% |
| 3 | Amazon.com, Inc. | 2.07% |
| 4 | Tesla, Inc. | 1.40% |
| 5 | NVIDIA Corporation | 1.37% |
| 6 | Alphabet Inc. Class A | 1.36% |
| 7 | Berkshire Hathaway Inc. Class B | 1.30% |
| 8 | Alphabet Inc. Class C | 1.18% |
| 9 | Exxon Mobil Corporation | 1.15% |
| 10 | UnitedHealth Group Incorporated | 1.13% |
| 11 | JPMorgan Chase & Co. | 1.06% |
| 12 | Johnson & Johnson | 1.01% |
| 13 | Meta Platforms Inc. Class A | 1.00% |
| 14 | Vanguard Cash Management Market Liquidity Fund | 0.93% |
| 15 | Visa Inc. Class A | 0.90% |
| 16 | Procter & Gamble Company | 0.82% |
| 17 | Mastercard Incorporated Class A | 0.77% |
| 18 | Home Depot, Inc. | 0.76% |
| 19 | Chevron Corporation | 0.71% |
| 20 | AbbVie, Inc. | 0.69% |
| 21 | Merck & Co., Inc. | 0.68% |
| 22 | Eli Lilly and Company | 0.67% |
| 23 | Broadcom Inc. | 0.61% |
| 24 | PepsiCo, Inc. | 0.60% |
| 25 | Bank of America Corp | 0.59% |
| 26 | Coca-Cola Company | 0.59% |
| 27 | Pfizer Inc. | 0.58% |
| 28 | Costco Wholesale Corporation | 0.54% |
| 29 | Thermo Fisher Scientific Inc. | 0.54% |
| 30 | McDonald’s Corporation | 0.49% |
| 31 | Walmart Inc. | 0.49% |
| 32 | Walt Disney Company | 0.46% |
| 33 | Cisco Systems, Inc. | 0.45% |
| 34 | Wells Fargo & Company | 0.45% |
| 35 | Abbott Laboratories | 0.45% |
| 36 | Linde plc | 0.44% |
| 37 | Accenture Plc Class A | 0.42% |
| 38 | Danaher Corporation | 0.41% |
| 39 | Comcast Corporation Class A | 0.41% |
| 40 | Texas Instruments Incorporated | 0.39% |
| 41 | Salesforce, Inc. | 0.39% |
| 42 | Verizon Communications Inc. | 0.39% |
| 43 | Philip Morris International Inc. | 0.38% |
| 44 | Adobe Incorporated | 0.38% |
| 45 | NIKE, Inc. Class B | 0.38% |
| 46 | Bristol-Myers Squibb Company | 0.37% |
| 47 | Raytheon Technologies Corporation | 0.36% |
| 48 | Netflix, Inc. | 0.36% |
| 49 | NextEra Energy, Inc. | 0.36% |
| 50 | QUALCOMM Incorporated | 0.35% |
| 51 | AT&T Inc. | 0.34% |
| 52 | United Parcel Service, Inc. Class B | 0.34% |
| 53 | Oracle Corporation | 0.33% |
| 54 | ConocoPhillips | 0.33% |
| 55 | Honeywell International Inc. | 0.33% |
| 56 | Union Pacific Corporation | 0.32% |
| 57 | Advanced Micro Devices, Inc. | 0.32% |
| 58 | Caterpillar Inc. | 0.32% |
| 59 | Lowe’s Companies, Inc. | 0.31% |
| 60 | Amgen Inc. | 0.31% |
| 61 | Morgan Stanley | 0.31% |
| 62 | Lockheed Martin Corporation | 0.31% |
| 63 | Charles Schwab Corp | 0.30% |
| 64 | Boeing Company | 0.30% |
| 65 | Starbucks Corporation | 0.30% |
| 66 | International Business Machines Corporation | 0.30% |
| 67 | Prologis, Inc. | 0.29% |
| 68 | Deere & Company | 0.29% |
| 69 | Elevance Health, Inc. | 0.28% |
| 70 | S&P Global, Inc. | 0.28% |
| 71 | Medtronic Plc | 0.28% |
| 72 | CVS Health Corporation | 0.28% |
| 73 | Goldman Sachs Group, Inc. | 0.28% |
| 74 | Intuit Inc. | 0.27% |
| 75 | Intel Corporation | 0.26% |
| 76 | Gilead Sciences, Inc. | 0.26% |
| 77 | Applied Materials, Inc. | 0.25% |
| 78 | BlackRock, Inc. | 0.25% |
| 79 | Booking Holdings Inc. | 0.25% |
| 80 | American Express Company | 0.25% |
| 81 | Analog Devices, Inc. | 0.24% |
| 82 | Citigroup Inc. | 0.24% |
| 83 | General Electric Company | 0.23% |
| 84 | American Tower Corporation | 0.23% |
| 85 | Automatic Data Processing, Inc. | 0.23% |
| 86 | Stryker Corporation | 0.23% |
| 87 | Cigna Group | 0.23% |
| 88 | Mondelez International, Inc. Class A | 0.23% |
| 89 | T-Mobile US, Inc. | 0.22% |
| 90 | ServiceNow, Inc. | 0.22% |
| 91 | TJX Companies Inc | 0.21% |
| 92 | Progressive Corporation | 0.21% |
| 93 | PayPal Holdings, Inc. | 0.21% |
| 94 | Chubb Limited | 0.21% |
| 95 | Altria Group, Inc. | 0.21% |
| 96 | Intuitive Surgical, Inc. | 0.21% |
| 97 | Marsh & McLennan Companies, Inc. | 0.20% |
| 98 | Target Corporation | 0.20% |
| 99 | Regeneron Pharmaceuticals, Inc. | 0.20% |
| 100 | Schlumberger N.V. | 0.19% |
| 101 | Vertex Pharmaceuticals Incorporated | 0.19% |
VTIチャート・配当金・配当利回り


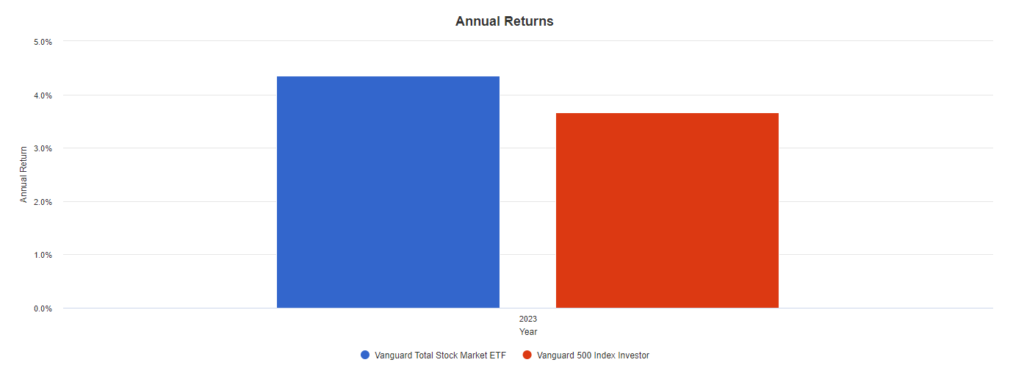
VTIはVTより安定があると思われていますが、
グラフのとおり同じような動きをします。
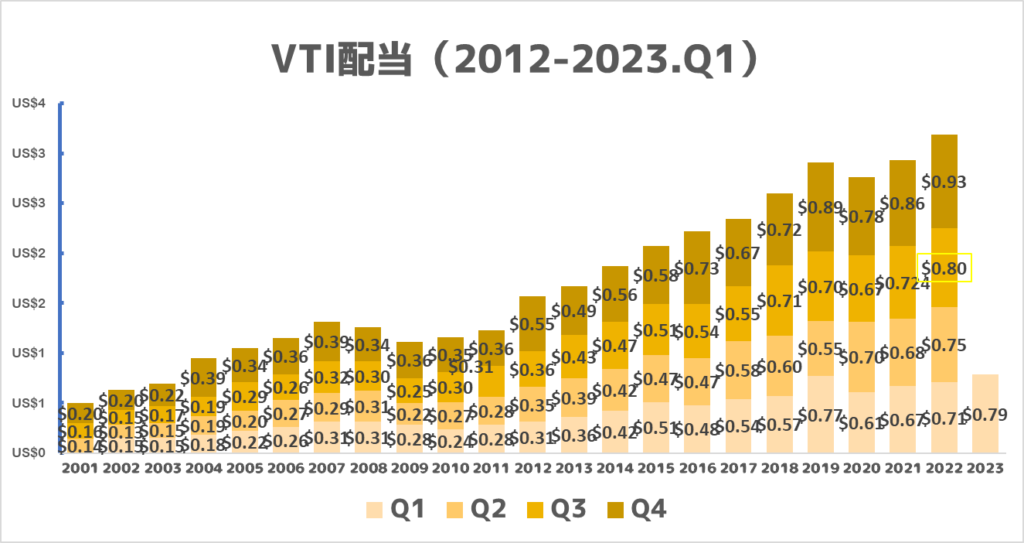
配当
| 西暦 | Q1 | Q2 | Q3 | Q4 | 合計 | 増配率 |
| 2001 | $0.14 | $0.16 | $0.20 | $0.49 | ||
| 2002 | $0.15 | $0.13 | $0.15 | $0.20 | $0.63 | 28.6% |
| 2003 | $0.15 | $0.15 | $0.17 | $0.22 | $0.69 | 9.5% |
| 2004 | $0.18 | $0.19 | $0.19 | $0.39 | $0.95 | 37.7% |
| 2005 | $0.22 | $0.20 | $0.29 | $0.34 | $1.04 | 9.5% |
| 2006 | $0.26 | $0.27 | $0.26 | $0.36 | $1.15 | 10.6% |
| 2007 | $0.31 | $0.29 | $0.32 | $0.39 | $1.30 | 13.0% |
| 2008 | $0.31 | $0.31 | $0.30 | $0.34 | $1.26 | -3.1% |
| 2009 | $0.28 | $0.22 | $0.25 | $0.36 | $1.11 | -11.9% |
| 2010 | $0.24 | $0.27 | $0.30 | $0.35 | $1.15 | 3.6% |
| 2011 | $0.28 | $0.28 | $0.31 | $0.36 | $1.23 | 7.0% |
| 2012 | $0.31 | $0.35 | $0.36 | $0.55 | $1.56 | 26.8% |
| 2013 | $0.36 | $0.39 | $0.43 | $0.49 | $1.67 | 7.1% |
| 2014 | $0.42 | $0.42 | $0.47 | $0.56 | $1.87 | 12.0% |
| 2015 | $0.51 | $0.47 | $0.51 | $0.58 | $2.07 | 10.7% |
| 2016 | $0.48 | $0.47 | $0.54 | $0.73 | $2.22 | 7.2% |
| 2017 | $0.54 | $0.58 | $0.55 | $0.67 | $2.34 | 5.4% |
| 2018 | $0.57 | $0.60 | $0.71 | $0.72 | $2.60 | 11.1% |
| 2019 | $0.77 | $0.55 | $0.70 | $0.89 | $2.90 | 11.5% |
| 2020 | $0.61 | $0.70 | $0.67 | $0.78 | $2.77 | -4.5% |
| 2021 | $0.67 | $0.68 | $0.724 | $0.86 | $2.93 | 5.8% |
| 2022 | $0.71 | $0.75 | $0.80 | $0.93 | $3.18 | 8.6% |
| 2023 | $0.79 |


今回の発表は、2023年Q1です。
まとめ


・チャートの下落相場は気になるが、セクター別やS&P500と比較しても堅調。
・投資するには安定感があり、むしろ下落相場では積極的に買い増しするチャンス。
・ただし配当目当ての投資家にとって、1.6%は魅力は少ない。
・VDEやVYMなど配当利回りが高いETFを買うことでリスク回避しつつ、相場の波につかめるか。


雑談(サラリーマン投資家ぐりっと目線)


VTIは2株ほど保有しています。
ETFで購入しようと考えていました。
しかし投資信託で積み立てに切り替えたため保有数は増えていません。
今後も買い増しの予定はありません。
年初来リターンは下がっていますが、今後も非常に優れてパフォーマンスが期待されます。
投資の選択肢の1つにくわえてみてもよいかもしれません。


コメント