

2021年の一般投資セクターETFをみてみよう。
投資は自己責任でお願いします。
目次
VCR 概要
銘柄名:Vanguard Consumer Discretionary ETF
銘柄構成数:322
運用会社:バンガード社
設定日:2004年1月26日
経費率:年率0.10%
配当利回り1.32%
 ぐりっと
ぐりっと2022/7/17の概要なので、自分で確認しよう!!!
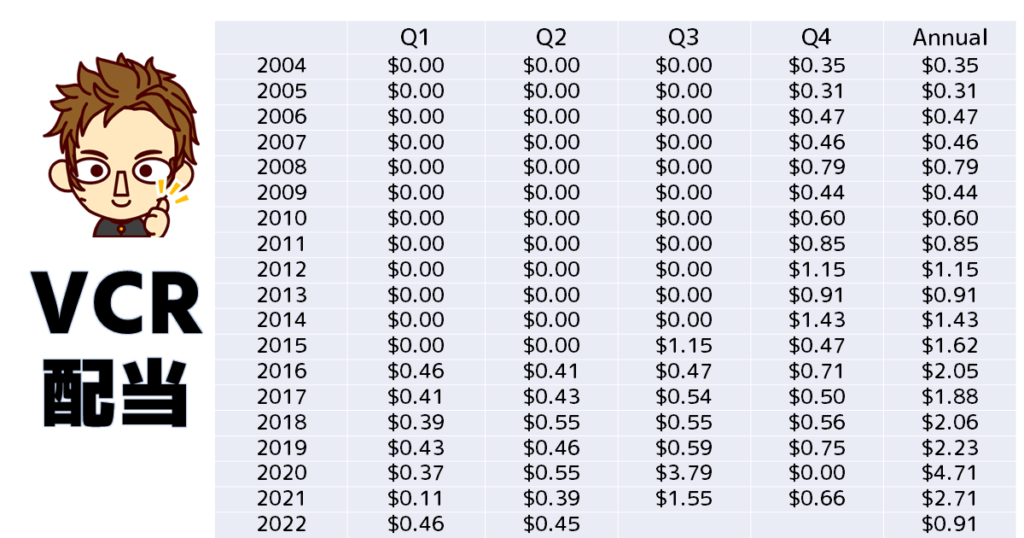
VCR 株価・配当金・配当利回り
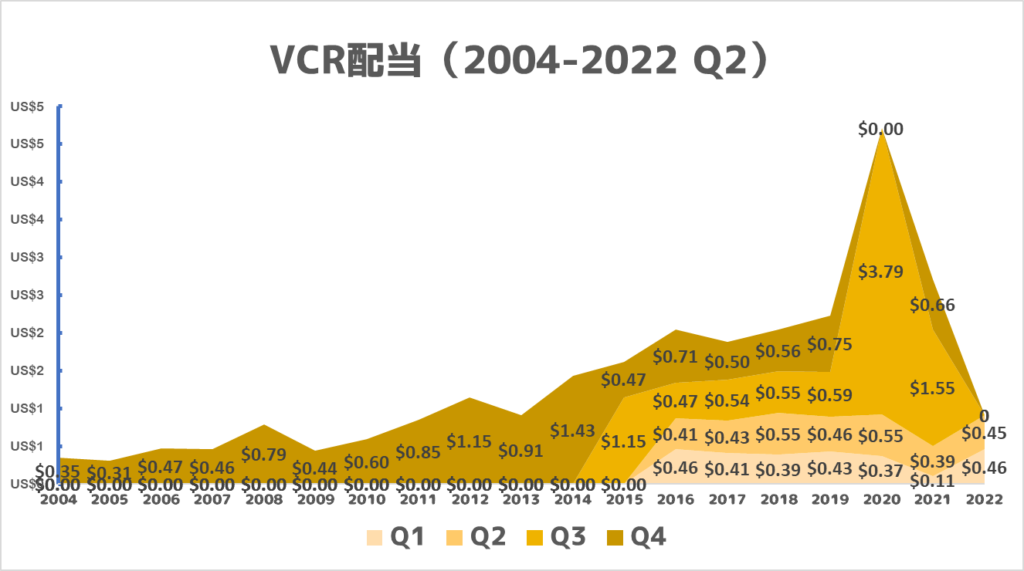
株価は2022年では大きく値下げり、2020年まで後退したね。
ぐりっと2020年は消費セクターにとっても厳しい戦いを強いられるね
 ぐりっと
ぐりっと株価にたいして配当金は少し物足りないかも?
VCR 構成銘柄と構成比率(2022年7月)
2022年3月時点の構成銘柄をすべて掲載しました。
VYMは年1回の入れ替えを行っており、個々の銘柄は個人で確認して参考程度でお願いします。
(投資は最終的に自己責任でお願いします。)
| 順位 | 構成銘柄 | 構成比率 |
|---|---|---|
| 1 | Amazon.com, Inc. | 23.19% |
| 2 | Tesla Inc | 13.90% |
| 3 | Home Depot, Inc. | 6.86% |
| 4 | McDonald’s Corporation | 4.08% |
| 5 | NIKE, Inc. Class B | 3.30% |
| 6 | Lowe’s Companies, Inc. | 2.85% |
| 7 | Booking Holdings Inc. | 2.00% |
| 8 | Starbucks Corporation | 1.97% |
| 9 | Target Corporation | 1.69% |
| 10 | TJX Companies Inc | 1.66% |
| 11 | Ford Motor Company | 1.18% |
| 12 | General Motors Company | 1.13% |
| 13 | Dollar General Corporation | 1.12% |
| 14 | Marriott International, Inc. Class A | 1.04% |
| 15 | O’Reilly Automotive, Inc. | 0.94% |
| 16 | AutoZone, Inc. | 0.93% |
| 17 | Hilton Worldwide Holdings Inc | 0.86% |
| 18 | Chipotle Mexican Grill, Inc. | 0.85% |
| 19 | Dollar Tree, Inc. | 0.80% |
| 20 | Yum! Brands, Inc. | 0.77% |
| 21 | Lululemon Athletica Inc | 0.76% |
| 22 | Airbnb, Inc. Class A | 0.69% |
| 23 | MercadoLibre, Inc. | 0.68% |
| 24 | Ross Stores, Inc. | 0.66% |
| 25 | Aptiv PLC | 0.64% |
| 26 | eBay Inc. | 0.63% |
| 27 | D.R. Horton, Inc. | 0.56% |
| 28 | Ulta Beauty Inc | 0.51% |
| 29 | Tractor Supply Company | 0.47% |
| 30 | Lennar Corporation Class A | 0.47% |
| 31 | U.S. Dollar | 0.44% |
| 32 | Genuine Parts Company | 0.43% |
| 33 | Expedia Group, Inc. | 0.42% |
| 34 | Best Buy Co., Inc. | 0.40% |
| 35 | V.F. Corporation | 0.38% |
| 36 | Garmin Ltd. | 0.36% |
| 37 | CarMax, Inc. | 0.36% |
| 38 | Pool Corporation | 0.36% |
| 39 | Darden Restaurants, Inc. | 0.36% |
| 40 | LKQ Corporation | 0.31% |
| 41 | Royal Caribbean Group | 0.30% |
| 42 | Domino’s Pizza, Inc. | 0.30% |
| 43 | MGM Resorts International | 0.28% |
| 44 | Las Vegas Sands Corp. | 0.28% |
| 45 | Hasbro, Inc. | 0.27% |
| 46 | Advance Auto Parts, Inc. | 0.26% |
| 47 | Service Corporation International | 0.26% |
| 48 | PulteGroup, Inc. | 0.26% |
| 49 | Burlington Stores, Inc. | 0.25% |
| 50 | Whirlpool Corporation | 0.25% |
| 51 | Bath & Body Works, Inc. | 0.24% |
| 52 | Etsy, Inc. | 0.24% |
| 53 | Vail Resorts, Inc. | 0.23% |
| 54 | Carnival Corporation | 0.23% |
| 55 | Caesars Entertainment Inc | 0.23% |
| 56 | BorgWarner Inc. | 0.22% |
| 57 | Williams-Sonoma, Inc. | 0.22% |
| 58 | Tapestry, Inc. | 0.21% |
| 59 | Lithia Motors, Inc. | 0.21% |
| 60 | Mattel, Inc. | 0.20% |
| 61 | Newell Brands Inc | 0.20% |
| 62 | Lear Corporation | 0.20% |
| 63 | GameStop Corp. Class A | 0.19% |
| 64 | Aramark | 0.19% |
| 65 | Wyndham Hotels & Resorts, Inc. | 0.17% |
| 66 | Deckers Outdoor Corporation | 0.17% |
| 67 | Mohawk Industries, Inc. | 0.17% |
| 68 | Gentex Corporation | 0.17% |
| 69 | Five Below, Inc. | 0.17% |
| 70 | Capri Holdings Limited | 0.17% |
| 71 | Wynn Resorts, Limited | 0.17% |
| 72 | Macy’s Inc | 0.16% |
| 73 | Churchill Downs Incorporated | 0.16% |
| 74 | Floor & Decor Holdings, Inc. Class A | 0.16% |
| 75 | Autoliv Inc. | 0.16% |
| 76 | Norwegian Cruise Line Holdings Ltd. | 0.16% |
| 77 | TopBuild Corp. | 0.15% |
| 78 | Polaris Inc. | 0.14% |
| 79 | Marriott Vacations Worldwide Corporation | 0.14% |
| 80 | Murphy USA, Inc. | 0.14% |
| 81 | Planet Fitness, Inc. Class A | 0.14% |
| 82 | H&R Block, Inc. | 0.14% |
| 83 | Brunswick Corporation | 0.14% |
| 84 | Toll Brothers, Inc. | 0.13% |
| 85 | Kohl’s Corporation | 0.13% |
| 86 | Bright Horizons Family Solutions, Inc. | 0.13% |
| 87 | Penn National Gaming, Inc. | 0.13% |
| 88 | Skechers U.S.A., Inc. Class A | 0.13% |
| 89 | Terminix Global Holdings Inc | 0.13% |
| 90 | Leggett & Platt, Incorporated | 0.13% |
| 91 | Harley-Davidson, Inc. | 0.12% |
| 92 | Texas Roadhouse, Inc. | 0.12% |
| 93 | Dick’s Sporting Goods, Inc. | 0.12% |
| 94 | PVH Corp. | 0.12% |
| 95 | Boyd Gaming Corporation | 0.12% |
| 96 | AutoNation, Inc. | 0.12% |
| 97 | RH | 0.12% |
| 98 | Ralph Lauren Corporation Class A | 0.11% |
| 99 | Choice Hotels International, Inc. | 0.11% |
| 100 | Tempur Sealy International Inc | 0.11% |
| 101 | Helen of Troy Limited | 0.11% |
| 102 | Hyatt Hotels Corporation Class A | 0.11% |
| 103 | Travel + Leisure Co. | 0.11% |
| 104 | Thor Industries, Inc. | 0.10% |
| 105 | DoorDash, Inc. Class A | 0.10% |
| 106 | Hanesbrands Inc. | 0.10% |
| 107 | Hilton Grand Vacations, Inc. | 0.10% |
| 108 | Asbury Automotive Group, Inc. | 0.10% |
| 109 | Light & Wonder, Inc. | 0.10% |
| 110 | Lucid Group, Inc. | 0.09% |
| 111 | Wayfair, Inc. Class A | 0.09% |
| 112 | Goodyear Tire & Rubber Company | 0.09% |
| 113 | YETI Holdings, Inc. | 0.09% |
| 114 | Penske Automotive Group, Inc. | 0.09% |
| 115 | Wendy’s Company | 0.09% |
| 116 | Victoria’s Secret & Company | 0.09% |
| 117 | Fox Factory Holding Corp. | 0.09% |
| 118 | Crocs, Inc. | 0.09% |
| 119 | Adient plc | 0.09% |
| 120 | Taylor Morrison Home Corporation | 0.08% |
| 121 | Visteon Corporation | 0.08% |
| 122 | Meritage Homes Corporation | 0.08% |
| 123 | Signet Jewelers Limited | 0.08% |
| 124 | Grand Canyon Education, Inc. | 0.08% |
| 125 | Carter’s, Inc. | 0.08% |
| 126 | LCI Industries | 0.08% |
| 127 | Papa John’s International, Inc. | 0.08% |
| 128 | Nordstrom, Inc. | 0.08% |
| 129 | Foot Locker, Inc. | 0.08% |
| 130 | Steven Madden, Ltd. | 0.08% |
| 131 | Group 1 Automotive, Inc. | 0.07% |
| 132 | Skyline Champion Corp. | 0.07% |
| 133 | Columbia Sportswear Company | 0.07% |
| 134 | KB Home | 0.07% |
| 135 | Installed Building Products, Inc. | 0.07% |
| 136 | Ollie’s Bargain Outlet Holdings Inc | 0.07% |
| 137 | Peloton Interactive, Inc. Class A | 0.07% |
| 138 | Dorman Products, Inc. | 0.07% |
| 139 | SeaWorld Entertainment, Inc. | 0.07% |
| 140 | Boot Barn Holdings, Inc. | 0.06% |
| 141 | Wingstop, Inc. | 0.06% |
| 142 | Graham Holdings Co. Class B | 0.06% |
| 143 | Callaway Golf Company | 0.06% |
| 144 | National Vision Holdings, Inc. | 0.06% |
| 145 | Vanguard Cash Management Market Liquidity Fund | 0.06% |
| 146 | Gentherm Incorporated | 0.06% |
| 147 | Six Flags Entertainment Corporation | 0.06% |
| 148 | Cracker Barrel Old Country Store, Inc. | 0.06% |
| 149 | Tri Pointe Homes, Inc. | 0.06% |
| 150 | Sonos, Inc. | 0.06% |
| 151 | Gap, Inc. | 0.06% |
| 152 | Chegg, Inc. | 0.06% |
| 153 | Dana Incorporated | 0.06% |
| 154 | M.D.C. Holdings, Inc. | 0.06% |
| 155 | Red Rock Resorts, Inc. Class A | 0.06% |
| 156 | Vista Outdoor Inc | 0.06% |
| 157 | LGI Homes, Inc. | 0.06% |
| 158 | Kontoor Brands, Inc. | 0.06% |
| 159 | Under Armour, Inc. Class A | 0.06% |
| 160 | Under Armour, Inc. Class C | 0.06% |
| 161 | Frontdoor, Inc. | 0.06% |
| 162 | Carvana Co. Class A | 0.06% |
| 163 | Cavco Industries, Inc. | 0.05% |
| 164 | Dillard’s, Inc. Class A | 0.05% |
| 165 | American Eagle Outfitters, Inc. | 0.05% |
| 166 | Bloomin’ Brands, Inc. | 0.05% |
| 167 | Wolverine World Wide, Inc. | 0.05% |
| 168 | Sally Beauty Holdings, Inc. | 0.05% |
| 169 | Monro Inc | 0.05% |
| 170 | Century Communities, Inc. | 0.05% |
| 171 | Shake Shack, Inc. Class A | 0.05% |
| 172 | Everi Holdings, Inc. | 0.05% |
| 173 | Chewy, Inc. Class A | 0.05% |
| 174 | Adtalem Global Education Inc. | 0.05% |
| 175 | Stride, Inc. | 0.05% |
| 176 | ODP Corporation | 0.05% |
| 177 | Winnebago Industries, Inc. | 0.05% |
| 178 | Cheesecake Factory Incorporated | 0.05% |
| 179 | Strategic Education, Inc. | 0.05% |
| 180 | Acushnet Holdings Corp. | 0.05% |
| 181 | Oxford Industries, Inc. | 0.05% |
| 182 | Shutterstock, Inc. | 0.04% |
| 183 | Dave & Buster’s Entertainment, Inc. | 0.04% |
| 184 | Laureate Education, Inc. | 0.04% |
| 185 | Rent-A-Center Inc | 0.04% |
| 186 | Tenneco Inc. Class A | 0.04% |
| 187 | Levi Strauss & Co. Class A | 0.04% |
| 188 | Rivian Automotive, Inc. Class A | 0.04% |
| 189 | Jack in the Box Inc. | 0.04% |
| 190 | Brinker International, Inc. | 0.04% |
| 191 | Urban Outfitters, Inc. | 0.04% |
| 192 | M/I Homes, Inc. | 0.04% |
| 193 | iRobot Corporation | 0.04% |
| 194 | Malibu Boats, Inc. Class A | 0.04% |
| 195 | Dine Brands Global, Inc. | 0.04% |
| 196 | Sturm, Ruger & Company, Inc. | 0.04% |
| 197 | Qurate Retail, Inc. Class A | 0.04% |
| 198 | Caleres, Inc. | 0.04% |
| 199 | Playa Hotels & Resorts N.V. | 0.04% |
| 200 | G-III Apparel Group, Ltd. | 0.04% |
| 201 | Camping World Holdings, Inc. Class A | 0.04% |
| 202 | Overstock.com, Inc. | 0.04% |
| 203 | La-Z-Boy Incorporated | 0.04% |
| 204 | Sleep Number Corporation | 0.04% |
| 205 | Revolve Group, Inc Class A | 0.03% |
| 206 | Buckle, Inc. | 0.03% |
| 207 | Designer Brands Inc. Class A | 0.03% |
| 208 | American Axle & Manufacturing Holdings, Inc. | 0.03% |
| 209 | Modine Manufacturing Company | 0.03% |
| 210 | Sonic Automotive, Inc. Class A | 0.03% |
| 211 | Abercrombie & Fitch Co. Class A | 0.03% |
| 212 | Monarch Casino & Resort, Inc. | 0.03% |
| 213 | Golden Entertainment, Inc. | 0.03% |
| 214 | Bally’s Corporation | 0.03% |
| 215 | MarineMax, Inc. | 0.03% |
| 216 | GoPro, Inc. Class A | 0.03% |
| 217 | America’s Car-Mart, Inc. | 0.03% |
| 218 | Green Brick Partners, Inc. | 0.03% |
| 219 | Guess?, Inc. | 0.03% |
| 220 | Smith & Wesson Brands, Inc. | 0.03% |
| 221 | Standard Motor Products, Inc. | 0.03% |
| 222 | Perdoceo Education Corporation | 0.03% |
| 223 | Genesco Inc. | 0.03% |
| 224 | Bed Bath & Beyond Inc. | 0.03% |
| 225 | Hibbett Inc | 0.03% |
| 226 | Denny’s Corporation | 0.03% |
| 227 | Accel Entertainment, Inc. Class A | 0.03% |
| 228 | Zumiez Inc. | 0.03% |
| 229 | Funko, Inc. Class A | 0.03% |
| 230 | Children’s Place, Inc. | 0.03% |
| 231 | BJ’s Restaurants, Inc. | 0.03% |
| 232 | Carriage Services Inc. | 0.03% |
| 233 | Winmark Corporation | 0.03% |
| 234 | Big Lots, Inc. | 0.03% |
| 235 | Ruth’s Hospitality Group, Inc. | 0.03% |
| 236 | Stoneridge, Inc. | 0.03% |
| 237 | OneSpaWorld Holdings Ltd. | 0.02% |
| 238 | Lindblad Expeditions Holdings, Inc. | 0.02% |
| 239 | Movado Group, Inc. | 0.02% |
| 240 | Ethan Allen Interiors Inc. | 0.02% |
| 241 | Beazer Homes USA, Inc. | 0.02% |
| 242 | Shoe Carnival, Inc. | 0.02% |
| 243 | Lovesac Company | 0.02% |
| 244 | PetMed Express, Inc. | 0.02% |
| 245 | Haverty Furniture Companies, Inc. | 0.02% |
| 246 | Chuy’s Holdings, Inc. | 0.02% |
| 247 | Johnson Outdoors Inc. Class A | 0.02% |
| 248 | Fossil Group, Inc. | 0.02% |
| 249 | Aaron’s Company Inc | 0.02% |
| 250 | Conn’s, Inc. | 0.02% |
| 251 | Groupon, Inc. | 0.02% |
| 252 | El Pollo Loco Holdings Inc | 0.02% |
| 253 | Quotient Technology Incorporated | 0.01% |
| 254 | WW International, Inc. | 0.01% |
| 255 | 1-800-FLOWERS.COM, Inc. Class A | 0.01% |
| 256 | Stitch Fix, Inc. Class A | 0.01% |
| 257 | Lands’ End, Inc. | 0.01% |
| 258 | Tupperware Brands Corporation | 0.01% |
| 259 | Dream Finders Homes, Inc. Class A | 0.01% |
| 260 | Academy Sports and Outdoors, Inc. | 0.01% |
| 261 | Leslie’s, Inc. | 0.01% |
| 262 | ARKO Corp | 0.01% |
| 263 | Franchise Group, Inc. Class A | 0.01% |
| 264 | Beachbody Co., Inc. Class A | 0.00% |
| 265 | RealReal, Inc. | 0.00% |
| 266 | Clarus Corporation | 0.00% |
| 267 | Petco Health & Wellness Company, Inc. Class A | 0.00% |
| 268 | European Wax Center, Inc. Class A | 0.00% |
| 269 | Patrick Industries, Inc. | 0.00% |
| 270 | Mister Car Wash, Inc. | 0.00% |
| 271 | Dutch Bros Inc. Class A | 0.00% |
| 272 | XPEL, Inc. | 0.00% |
| 273 | AMMO Inc | 0.00% |
| 274 | Fisker Inc Class A | 0.00% |
| 275 | Xometry, Inc. Class A | 0.00% |
| 276 | Snap One Holdings Corp. | 0.00% |
| 277 | First Watch Restaurant Group, Inc. | 0.00% |
| 278 | Allbirds, Inc. Class A | 0.00% |
| 279 | Faraday Future Intelligent Electric Inc. | 0.00% |
| 280 | Vivid Seats Inc. Class A | 0.00% |
| 281 | Rover Group, Inc. Class A | 0.00% |
| 282 | Bowlero Corp. Class A | 0.00% |
| 283 | ContextLogic, Inc. Class A | 0.00% |
| 284 | NVR, Inc. | 0.00% |
| 285 | Kura Sushi USA, Inc. Class A | 0.00% |
| 286 | Poshmark, Inc. Class A | 0.00% |
| 287 | Membership Collective Group, Inc. Class A | 0.00% |
| 288 | Luminar Technologies, Inc. Class A | 0.00% |
| 289 | ADT, Inc. | 0.00% |
| 290 | F45 Training Holdings, Inc. | 0.00% |
| 291 | Duolingo, Inc. Class A | 0.00% |
| 292 | Sportsman’s Warehouse Holdings, Inc. | 0.00% |
| 293 | Life Time Group Holdings, Inc. | 0.00% |
| 294 | Coursera Inc | 0.00% |
| 295 | Warby Parker, Inc. Class A | 0.00% |
| 296 | QuantumScape Corporation Class A | 0.00% |
| 297 | EVgo, Inc. Class A | 0.00% |
| 298 | Krispy Kreme, Inc. | 0.00% |
| 299 | Liquidity Services, Inc. | 0.00% |
| 300 | Solid Power, Inc. Class A | 0.00% |
| 301 | PowerSchool Holdings, Inc. Class A | 0.00% |
| 302 | Workhorse Group Inc. | 0.00% |
| 303 | Vivint Smart Home, Inc. Class A | 0.00% |
| 304 | PLBY Group, Inc. | 0.00% |
| 305 | Traeger, Inc. | 0.00% |
| 306 | Portillo’s, Inc. Class A | 0.00% |
| 307 | Canoo Inc. Class A | 0.00% |
| 308 | Cricut, Inc. Class A | 0.00% |
| 309 | thredUP, Inc. Class A | 0.00% |
| 310 | Porch Group, Inc. | 0.00% |
| 311 | BARK Inc Class A | 0.00% |
| 312 | Latham Group Inc | 0.00% |
| 313 | Lordstown Motors Corp. Class A | 0.00% |
| 314 | 2U, Inc. | 0.00% |
| 315 | Boxed, Inc. | 0.00% |
| 316 | GAN Limited | 0.00% |
| 317 | GrowGeneration Corp. | 0.00% |
| 318 | XL Fleet Corp. Class A | 0.00% |
| 319 | Shift Technologies Inc Class A | 0.00% |
| 320 | Vroom, Inc. | 0.00% |
| 321 | Electric Last Mile Solutions, Inc. Class A | 0.00% |
| 322 | Universal Electronics Inc. | 0.00% |
| 323 | Vuzix Corporation | 0.00% |
| 324 | Purple Innovation, Inc. | 0.00% |
| 325 | Rush Street Interactive, Inc. Class A | 0.00% |
Amazon、tesla、ホームデポ。
上位銘柄は知名度が高いね
ぐりっとそうだね。
この上位銘柄であれば個別購入の方がリスク分散になるかもね
構成はどうなっているの?
ぐりっと上位10銘柄に61.50%
上位20銘柄に71.12%
上位50銘柄に83.72%。
前回より上位銘柄の構成比率が増えている。
偏りが増したETFだよ
2022年のパフォーマンス(VOOとVCRを比較する)
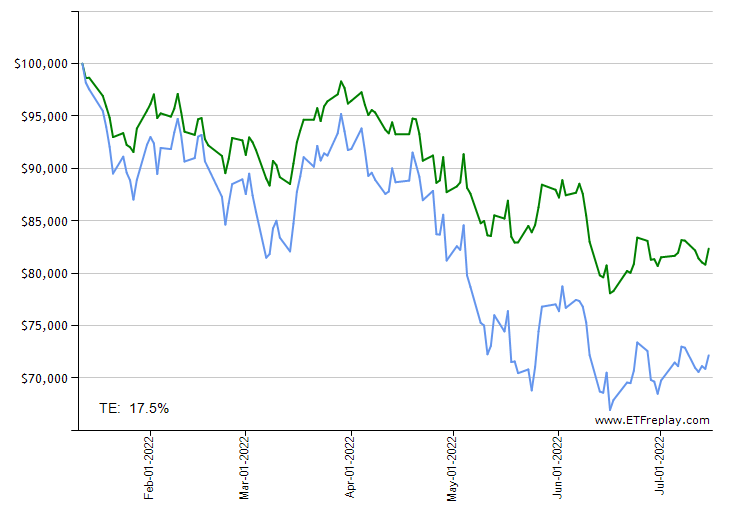
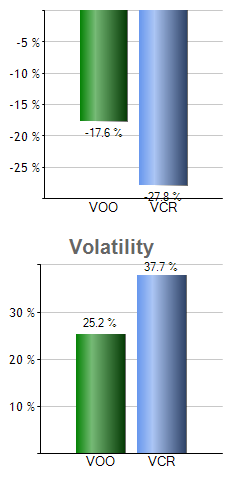
VOOと比較してみてもパフォーマンスが低い。
またvolatilityも高い。
リセッションの強いはずの消費セクターも2022年前期は苦戦しているね。
まとめ
・VCRはインカムゲイン、トータルリターンではVOOよりパフォーマンスがよい。
・投資対象として銘柄を個別で購入したいのであれば検討の余地あり
・インデックス投資としては不向き。
雑談(サラリーマン投資家ぐりっと目線)
総資産1000万家計のぐりっとはいくらETFに投資している?
購入予定なし。
ぐりっと投資は最後は自己責任でお願いします。
関連記事:あわせて読みたい
あわせて読みたい

バンガード・米国高配当株式ETF【VYM】全銘柄を網羅してみた!! 2022年6月のVYMが増配されます。
これを記念してVYMについてまとめてみました。411銘柄を掲載しています。人気の記事です。
あわせて読みたい

【ETF】全世界と全米とS&P500とヘルスケア、どれが最強か知っている? 今回のテーマは、全世界と全米とS&P500とヘルスケア、どれが強いか知っていますか?です。 既存の記事の内容を少し変更して再構成しました。 どのETFのパフォーマンス…
投稿が見つかりません。
あわせて読みたい

バンガード社のETFをまとめてみた【2021年12月22日】 今回のテーマはバンガード社のETFです。 世界で初めてインデックス投資ETFを扱った会社でもあり、投資の世界では知らない人はいないと思います。 そのバンガード社が取…


コメント