投資は人を成長させるをコンセプトにしているブロガー、Youtuber、40代サラリーマン投資家ぐりっとです。
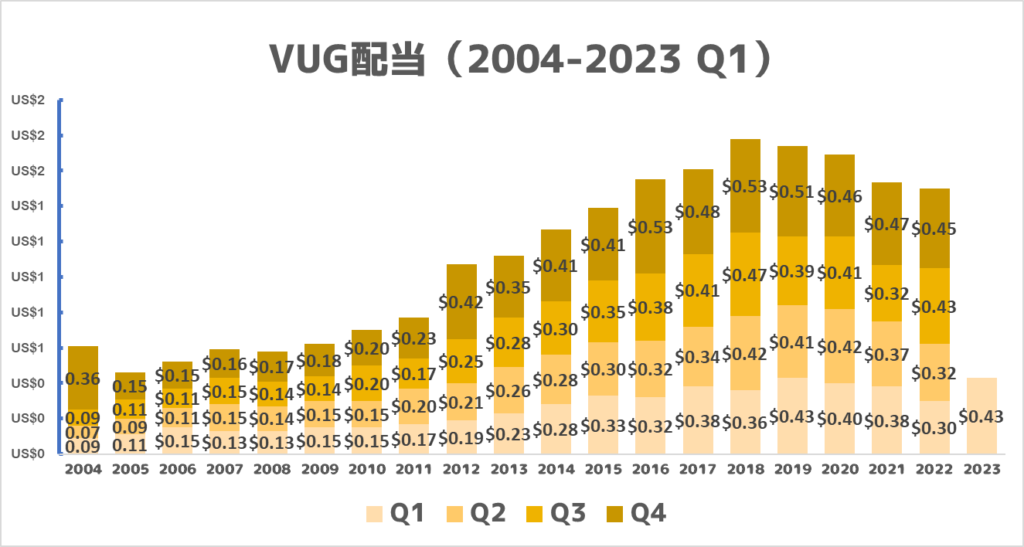
VUGの2023年Q1(3月)の配当金が発表されました。
2023年Q1(1月)の配当実績は$0.429000でした。(ブログ内で$0.43と記載しています)
2022年Q1は$0.300600(ブログ内では$0.30と記載)、前年同期比42.78%増配になりました。
ハイテク銘柄なので、配当利回り目当ての人は少ないかも?
増配率は以下のように計算できます。
増配率 = (今年度配当金 – 前年度配当金)/ 前年度配当金増配率
(0.429 – 0.3006)/ 0.3006 =0.4278
したがって、増配率は約42.78%となります。


2023年Q1では検討していますね。
参考サイト
VIGの投資成績を詳しく知りたい人はバンガード社・Bloombergのウエイブサイトを参考にしてください。

2023年Q1の成績一覧表 あわせて読みたい


 ぐりっと
ぐりっとここからは2023年Q1をこれからも更新していきます。
VUG 概要


銘柄名:Vanguard Growth ETF
銘柄構成数:254
運用会社:バンガード社
設定日:2004年1月
経費率:年率0.04%
配当利回り0.71%
1年トータルリターン:-15.05%
3年トータルリターン:18.03%
5年トータルリターン:12.41%
構成銘柄
| 1 | Apple Inc. | 13.07% |
| 2 | Microsoft Corporation | 10.91% |
| 3 | Amazon.com, Inc. | 4.79% |
| 4 | Tesla, Inc. | 3.24% |
| 5 | NVIDIA Corporation | 3.18% |
| 6 | Alphabet Inc. Class A | 3.16% |
| 7 | Alphabet Inc. Class C | 2.74% |
| 8 | Visa Inc. Class A | 2.03% |
| 9 | Mastercard Incorporated Class A | 1.79% |
| 10 | Home Depot, Inc. | 1.77% |
| 11 | Costco Wholesale Corporation | 1.26% |
| 12 | Thermo Fisher Scientific Inc. | 1.25% |
| 13 | Meta Platforms Inc. Class A | 1.15% |
| 14 | McDonald’s Corporation | 1.13% |
| 15 | Walt Disney Company | 1.07% |
| 16 | Linde plc | 1.01% |
| 17 | Accenture Plc Class A | 0.98% |
| 18 | Texas Instruments Incorporated | 0.91% |
| 19 | Salesforce, Inc. | 0.91% |
| 20 | Adobe Incorporated | 0.88% |
| 21 | NIKE, Inc. Class B | 0.88% |
| 22 | Netflix, Inc. | 0.82% |
| 23 | Eli Lilly and Company | 0.78% |
| 24 | Advanced Micro Devices, Inc. | 0.74% |
| 25 | Lowe’s Companies, Inc. | 0.73% |
| 26 | Boeing Company | 0.70% |
| 27 | Starbucks Corporation | 0.69% |
| 28 | S&P Global, Inc. | 0.65% |
| 29 | Intuit Inc. | 0.64% |
| 30 | Applied Materials, Inc. | 0.59% |
| 31 | Booking Holdings Inc. | 0.57% |
| 32 | American Tower Corporation | 0.54% |
| 33 | Automatic Data Processing, Inc. | 0.54% |
| 34 | Stryker Corporation | 0.53% |
| 35 | T-Mobile US, Inc. | 0.52% |
| 36 | ServiceNow, Inc. | 0.51% |
| 37 | TJX Companies Inc | 0.50% |
| 38 | PayPal Holdings, Inc. | 0.49% |
| 39 | Danaher Corporation | 0.48% |
| 40 | Intuitive Surgical, Inc. | 0.48% |
| 41 | Vertex Pharmaceuticals Incorporated | 0.44% |
| 42 | Zoetis, Inc. Class A | 0.41% |
| 43 | QUALCOMM Incorporated | 0.41% |
| 44 | Boston Scientific Corporation | 0.39% |
| 45 | United Parcel Service, Inc. Class B | 0.39% |
| 46 | Lam Research Corporation | 0.39% |
| 47 | Fiserv, Inc. | 0.39% |
| 48 | Blackstone Inc. | 0.37% |
| 49 | Union Pacific Corporation | 0.37% |
| 50 | Equinix, Inc. | 0.37% |
| 51 | Uber Technologies, Inc. | 0.37% |
| 52 | Aon Plc Class A | 0.35% |
| 53 | Palo Alto Networks, Inc. | 0.33% |
| 54 | Crown Castle Inc. | 0.33% |
| 55 | Synopsys, Inc. | 0.33% |
| 56 | KLA Corporation | 0.32% |
| 57 | Cadence Design Systems, Inc. | 0.31% |
| 58 | O’Reilly Automotive, Inc. | 0.30% |
| 59 | Sherwin-Williams Company | 0.30% |
| 60 | Estee Lauder Companies Inc. Class A | 0.30% |
| 61 | Edwards Lifesciences Corporation | 0.29% |
| 62 | Dollar General Corporation | 0.29% |
| 63 | Marriott International, Inc. Class A | 0.28% |
| 64 | AutoZone, Inc. | 0.28% |
| 65 | Amphenol Corporation Class A | 0.27% |
| 66 | Roper Technologies, Inc. | 0.27% |
| 67 | Moderna, Inc. | 0.27% |
| 68 | Pioneer Natural Resources Company | 0.27% |
| 69 | Moody’s Corporation | 0.27% |
| 70 | Public Storage | 0.26% |
| 71 | Microchip Technology Incorporated | 0.26% |
| 72 | Airbnb, Inc. Class A | 0.26% |
| 73 | Autodesk, Inc. | 0.25% |
| 74 | DexCom, Inc. | 0.25% |
| 75 | Snowflake, Inc. Class A | 0.25% |
| 76 | Agilent Technologies, Inc. | 0.25% |
| 77 | Chipotle Mexican Grill, Inc. | 0.24% |
| 78 | Block, Inc. Class A | 0.24% |
| 79 | Ecolab Inc. | 0.24% |
| 80 | MSCI Inc. Class A | 0.23% |
| 81 | Fortinet, Inc. | 0.23% |
| 82 | IDEXX Laboratories, Inc. | 0.23% |
| 83 | Cheniere Energy, Inc. | 0.23% |
| 84 | Hilton Worldwide Holdings Inc | 0.23% |
| 85 | IQVIA Holdings Inc | 0.23% |
| 86 | Regeneron Pharmaceuticals, Inc. | 0.23% |
| 87 | Marvell Technology, Inc. | 0.23% |
| 88 | TransDigm Group Incorporated | 0.23% |
| 89 | Ross Stores, Inc. | 0.23% |
| 90 | Cintas Corporation | 0.22% |
| 91 | Lululemon Athletica Inc | 0.22% |
| 92 | Schlumberger N.V. | 0.22% |
| 93 | Hess Corporation | 0.22% |
| 94 | Workday, Inc. Class A | 0.22% |
| 95 | Charter Communications, Inc. Class A | 0.22% |
| 96 | Monster Beverage Corporation | 0.22% |
| 97 | Yum! Brands, Inc. | 0.21% |
| 98 | Paychex, Inc. | 0.21% |
| 99 | Hershey Company | 0.21% |
| 100 | Waste Connections, Inc. | 0.20% |
| 101 | Rockwell Automation, Inc. | 0.20% |
| 102 | Old Dominion Freight Line, Inc. | 0.20% |
| 103 | Mettler-Toledo International Inc. | 0.19% |
| 104 | Vanguard Cash Management Market Liquidity Fund | 0.19% |
| 105 | Arista Networks, Inc. | 0.19% |
| 106 | Aptiv PLC | 0.18% |
| 107 | Illumina, Inc. | 0.18% |
| 108 | ResMed Inc. | 0.18% |
| 109 | Electronic Arts Inc. | 0.18% |
| 110 | Colgate-Palmolive Company | 0.18% |
| 111 | Copart, Inc. | 0.18% |
| 112 | Albemarle Corporation | 0.17% |
| 113 | Fastenal Company | 0.17% |
| 114 | CoStar Group, Inc. | 0.17% |
| 115 | Enphase Energy, Inc. | 0.17% |
| 116 | Keysight Technologies Inc | 0.17% |
| 117 | Global Payments Inc. | 0.17% |
| 118 | SBA Communications Corp. Class A | 0.16% |
| 119 | Activision Blizzard, Inc. | 0.16% |
| 120 | Verisk Analytics Inc | 0.16% |
| 121 | Ulta Beauty Inc. | 0.16% |
| 122 | ANSYS, Inc. | 0.16% |
| 123 | CrowdStrike Holdings, Inc. Class A | 0.15% |
| 124 | Tractor Supply Company | 0.15% |
| 125 | Seagen, Inc. | 0.15% |
| 126 | Horizon Therapeutics Public Limited Company | 0.15% |
| 127 | Equifax Inc. | 0.15% |
| 128 | Trade Desk, Inc. Class A | 0.15% |
| 129 | Diamondback Energy, Inc. | 0.15% |
| 130 | Gartner, Inc. | 0.14% |
| 131 | Atlassian Corp Class A | 0.14% |
| 132 | Apollo Global Management Inc. | 0.14% |
| 133 | Alnylam Pharmaceuticals, Inc | 0.14% |
| 134 | West Pharmaceutical Services, Inc. | 0.14% |
| 135 | Veeva Systems Inc Class A | 0.14% |
| 136 | Quanta Services, Inc. | 0.14% |
| 137 | Align Technology, Inc. | 0.13% |
| 138 | Vulcan Materials Company | 0.13% |
| 139 | Motorola Solutions, Inc. | 0.13% |
| 140 | Monolithic Power Systems, Inc. | 0.13% |
| 141 | Church & Dwight Co., Inc. | 0.12% |
| 142 | Teledyne Technologies Incorporated | 0.12% |
| 143 | Datadog Inc Class A | 0.12% |
| 144 | Brown-Forman Corporation Class B | 0.12% |
| 145 | Realty Income Corporation | 0.12% |
| 146 | Las Vegas Sands Corp. | 0.12% |
| 147 | Insulet Corporation | 0.11% |
| 148 | Invitation Homes, Inc. | 0.11% |
| 149 | Coterra Energy Inc. | 0.11% |
| 150 | BioMarin Pharmaceutical Inc. | 0.11% |
| 151 | Waters Corporation | 0.11% |
| 152 | Take-Two Interactive Software, Inc. | 0.11% |
| 153 | Skyworks Solutions, Inc. | 0.10% |
| 154 | HubSpot, Inc. | 0.10% |
| 155 | VeriSign, Inc. | 0.10% |
| 156 | Sun Communities, Inc. | 0.10% |
| 157 | EPAM Systems, Inc. | 0.10% |
| 158 | Splunk Inc. | 0.10% |
| 159 | Broadridge Financial Solutions, Inc. | 0.10% |
| 160 | Expedia Group, Inc. | 0.10% |
| 161 | Cloudflare Inc Class A | 0.10% |
| 162 | Cooper Companies, Inc. | 0.09% |
| 163 | Marathon Oil Corporation | 0.09% |
| 164 | FactSet Research Systems Inc. | 0.09% |
| 165 | DoorDash, Inc. Class A | 0.09% |
| 166 | Teradyne, Inc. | 0.09% |
| 167 | Avantor, Inc. | 0.09% |
| 168 | Zoom Video Communications, Inc. Class A | 0.09% |
| 169 | Zebra Technologies Corporation Class A | 0.09% |
| 170 | Baker Hughes Company Class A | 0.09% |
| 171 | Royal Caribbean Group | 0.09% |
| 172 | Etsy, Inc. | 0.09% |
| 173 | W.W. Grainger, Inc. | 0.09% |
| 174 | U.S. Dollar | 0.09% |
| 175 | Digital Realty Trust, Inc. | 0.09% |
| 176 | J.B. Hunt Transport Services, Inc. | 0.09% |
| 177 | Halliburton Company | 0.09% |
| 178 | Pinterest, Inc. Class A | 0.09% |
| 179 | Paycom Software, Inc. | 0.09% |
| 180 | Incyte Corporation | 0.09% |
| 181 | Burlington Stores, Inc. | 0.08% |
| 182 | MongoDB, Inc. Class A | 0.08% |
| 183 | Tyler Technologies, Inc. | 0.08% |
| 184 | Palantir Technologies Inc. Class A | 0.08% |
| 185 | Trimble Inc. | 0.08% |
| 186 | Ares Management Corporation | 0.07% |
| 187 | Rivian Automotive, Inc. Class A | 0.07% |
| 188 | DocuSign, Inc. | 0.07% |
| 189 | MarketAxess Holdings Inc. | 0.07% |
| 190 | Roblox Corp. Class A | 0.07% |
| 191 | GoDaddy, Inc. Class A | 0.07% |
| 192 | Twilio, Inc. Class A | 0.07% |
| 193 | Catalent Inc | 0.07% |
| 194 | Live Nation Entertainment, Inc. | 0.07% |
| 195 | Match Group, Inc. | 0.07% |
| 196 | Zscaler, Inc. | 0.07% |
| 197 | First Republic Bank | 0.07% |
| 198 | Martin Marietta Materials, Inc. | 0.07% |
| 199 | Liberty Broadband Corp. Class C | 0.06% |
| 200 | Domino’s Pizza, Inc. | 0.06% |
| 201 | Caesars Entertainment Inc | 0.06% |
| 202 | Snap, Inc. Class A | 0.06% |
| 203 | Okta, Inc. Class A | 0.06% |
| 204 | Bio-Rad Laboratories, Inc. Class A | 0.06% |
| 205 | HEICO Corporation Class A | 0.06% |
| 206 | Rollins, Inc. | 0.06% |
| 207 | Unity Software, Inc. | 0.06% |
| 208 | LPL Financial Holdings Inc. | 0.06% |
| 209 | STERIS Plc | 0.06% |
| 210 | Coinbase Global, Inc. Class A | 0.05% |
| 211 | Bentley Systems, Incorporated Class B | 0.05% |
| 212 | Black Knight, Inc. | 0.05% |
| 213 | Plug Power Inc. | 0.05% |
| 214 | SVB Financial Group | 0.05% |
| 215 | BILL Holdings, Inc. | 0.05% |
| 216 | ZoomInfo Technologies Inc | 0.05% |
| 217 | Roku, Inc. Class A | 0.05% |
| 218 | Tradeweb Markets, Inc. Class A | 0.05% |
| 219 | PerkinElmer, Inc. | 0.05% |
| 220 | NVR, Inc. | 0.05% |
| 221 | Lamb Weston Holdings, Inc. | 0.04% |
| 222 | UDR, Inc. | 0.04% |
| 223 | HEICO Corporation | 0.04% |
| 224 | Pool Corporation | 0.04% |
| 225 | MGM Resorts International | 0.04% |
| 226 | Zillow Group, Inc. Class C | 0.04% |
| 227 | Brown & Brown, Inc. | 0.04% |
| 228 | TransUnion | 0.04% |
| 229 | Camden Property Trust | 0.04% |
| 230 | Jack Henry & Associates, Inc. | 0.04% |
| 231 | Charles River Laboratories International, Inc. | 0.03% |
| 232 | Texas Pacific Land Corporation | 0.03% |
| 233 | EQT Corporation | 0.03% |
| 234 | Vail Resorts, Inc. | 0.03% |
| 235 | Interactive Brokers Group, Inc. Class A | 0.02% |
| 236 | Generac Holdings Inc. | 0.02% |
| 237 | Warner Music Group Corp. Class A | 0.02% |
| 238 | Chewy, Inc. Class A | 0.02% |
| 239 | Brown-Forman Corporation Class A | 0.02% |
| 240 | Endeavor Group Holdings, Inc. Class A | 0.02% |
| 241 | Toast, Inc. Class A | 0.02% |
| 242 | Dropbox, Inc. Class A | 0.02% |
| 243 | Sirius XM Holdings, Inc. | 0.02% |
| 244 | UiPath, Inc. Class A | 0.01% |
| 245 | Zillow Group, Inc. Class A | 0.01% |
| 246 | Liberty Broadband Corp. Class A | 0.01% |
| 247 | AppLovin Corp. Class A | 0.01% |
| 248 | Olaplex Holdings, Inc. | 0.00% |
| 249 | Micron Technology, Inc. | 0.00% |
| 250 | Ball Corporation | 0.00% |
| 251 | FLEETCOR Technologies, Inc. | 0.00% |
| 252 | Exact Sciences Corporation | 0.00% |
| 253 | agilon health inc | 0.00% |
| 254 | Qualtrics International, Inc. Class A | 0.00% |
VUG 株価・配当金・配当利回り


配当金


| Q1 | Q2 | Q3 | Q4 | Annual | 増配率 | |
| 2004 | 0.09 | 0.07 | 0.09 | 0.36 | $0.61 | |
| 2005 | 0.11 | 0.09 | 0.11 | 0.15 | $0.46 | -24.6% |
| 2006 | $0.15 | $0.11 | $0.11 | $0.15 | $0.52 | 13.0% |
| 2007 | $0.13 | $0.15 | $0.15 | $0.16 | $0.59 | 13.5% |
| 2008 | $0.13 | $0.14 | $0.14 | $0.17 | $0.58 | -1.7% |
| 2009 | $0.15 | $0.15 | $0.14 | $0.18 | $0.62 | 6.9% |
| 2010 | $0.15 | $0.15 | $0.20 | $0.20 | $0.70 | 12.9% |
| 2011 | $0.17 | $0.20 | $0.17 | $0.23 | $0.77 | 10.0% |
| 2012 | $0.19 | $0.21 | $0.25 | $0.42 | $1.07 | 39.0% |
| 2013 | $0.23 | $0.26 | $0.28 | $0.35 | $1.12 | 4.7% |
| 2014 | $0.28 | $0.28 | $0.30 | $0.41 | $1.27 | 13.4% |
| 2015 | $0.33 | $0.30 | $0.35 | $0.41 | $1.39 | 9.4% |
| 2016 | $0.32 | $0.32 | $0.38 | $0.53 | $1.55 | 11.5% |
| 2017 | $0.38 | $0.34 | $0.41 | $0.48 | $1.61 | 3.9% |
| 2018 | $0.36 | $0.42 | $0.47 | $0.53 | $1.78 | 10.6% |
| 2019 | $0.43 | $0.41 | $0.39 | $0.51 | $1.74 | -2.2% |
| 2020 | $0.40 | $0.42 | $0.41 | $0.46 | $1.69 | -2.9% |
| 2021 | $0.38 | $0.37 | $0.32 | $0.47 | $1.54 | -9.1% |
| 2022 | $0.30 | $0.32 | $0.43 | $0.45 | $1.50 | -2.4% |
| 2023 | $0.43 | $0.43 | -71.4% |


今回の発表は、この部分です。
まとめ


・2023年Q1は42.78%増配。
・グロース株は配当利回りの不安定感は否めない。
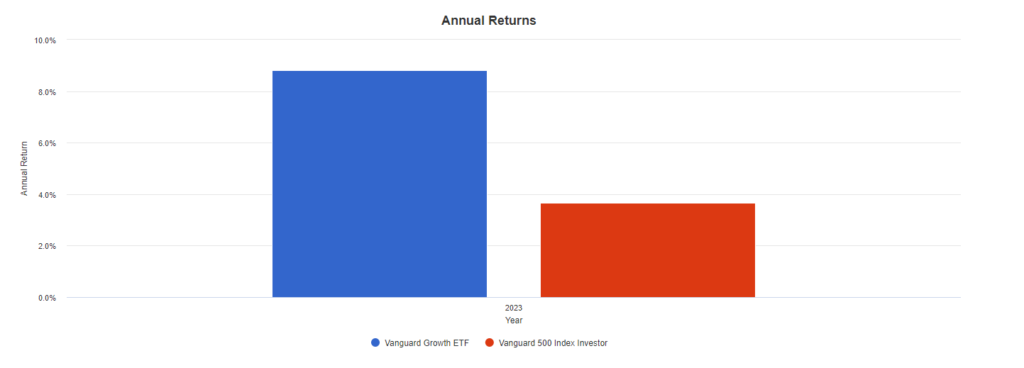
・ただしS&P500と比較すると2023年Q1では好調。
・短期的には上昇トレンドに乗るのも投資としては面白い。
雑談(サラリーマン投資家ぐりっと目線)


VUG株を1株保有しています。VUGはテクノロジー銘柄に特化したETFで、成長株投資家にとっては注目すべき銘柄の一つです。
しかしながら、VUGの配当利回りは低く、また、テクノロジー銘柄のチャートは不安定で、読み取りにくい傾向にあります。この点に関しては、QQQに劣るといわざるを得ません。
私自身は現在VUGを追加で購入する予定はありませんが、今後の動向に注目していくつもりです。
ETFについて興味を持っている方は、私たちのTwitterアカウントで最新情報を発信しています。
また私たちのブログでは他のETFについてもまとめていますので、参考になれば嬉しいです。
投資は、投資家が自己の責任で行う行為であることを忘れてはなりません。投資には、市場の変動やリスクが伴います。そのため、投資家は自己責任に基づいて、リスクを認識し、投資に関する情報を十分に収集して判断する必要があります。また、投資に関する決定は、投資家自身が行い、その結果に対する責任も負わなければなりません。投資家は、自己の投資目的やリスク許容度を考慮し、自己の資金を適切に管理する必要があります。投資は、将来の利益を得ることができる可能性がありますが、一方で損失を被る可能性もあります。そのため、投資家は自己責任に基づいて投資を行い、損失を最小限に抑えるために十分な注意を払うことが重要です。
関連記事:あわせて読みたい
当ブログでは、2023年のQ1に行われたETF決算についてまとめた記事を掲載しています。
さらに、市場に関する新しい発見や勉強になる情報を提供するため、幅広いトピックについて記事を執筆しています。
また、SEO対策にも力を入れており、検索エンジンでの上位表示を目指しています。私たちの記事を読んでいただくことで、より多くの方に投資に関する知識を広めることができると考えています。


コメント