本と投資は人を成長させるをコンセプトにしているブロガー、Youtuber、40代サラリーマン投資家ぐりっとです。
VYMの2022年Q3(9月)の配当金が発表されました。
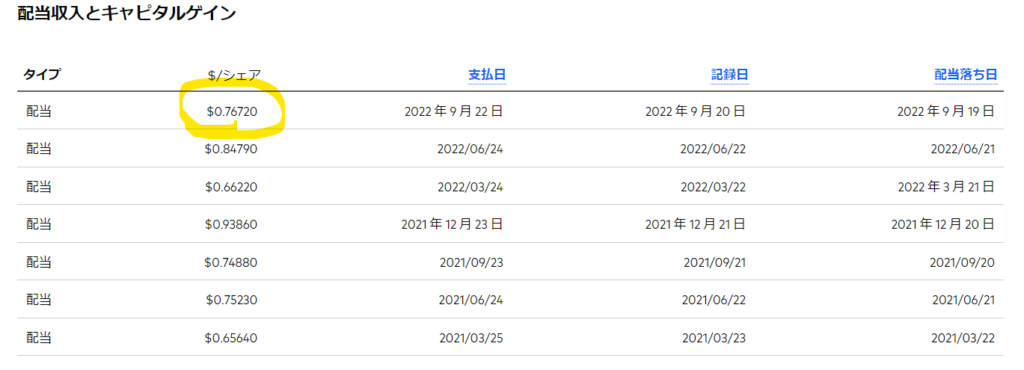
2022年9月の配当実績は0.7672$でした。(ブログ内では0.77$と記載しています)
Q3の支払いは9月22日となっています。
2021年と比較して2.45%増配です。
うれしい~。

参考サイト
VYMの投資成績を詳しく知りたい人はバンガード社のホームページを参考にしてください。
VYM 基本知識

銘柄名:バンガード・米国高配当株式ETF
銘柄構成数:411(ブログの後半にすべて記載)
運用会社:バンガード社
設定日:2006年11月
経費率:年率0.06%
ベンチマーク:FTSEハイディビデンド・イールド・インデックス
VYM 株価・配当金・配当利回り

2022年はパフォーマンスはイマイチだね。
 ぐりっと
ぐりっとそうだね。
高配当銘柄がディフェンシブ銘柄が多いので
良く持ちこたえていると思うよ。


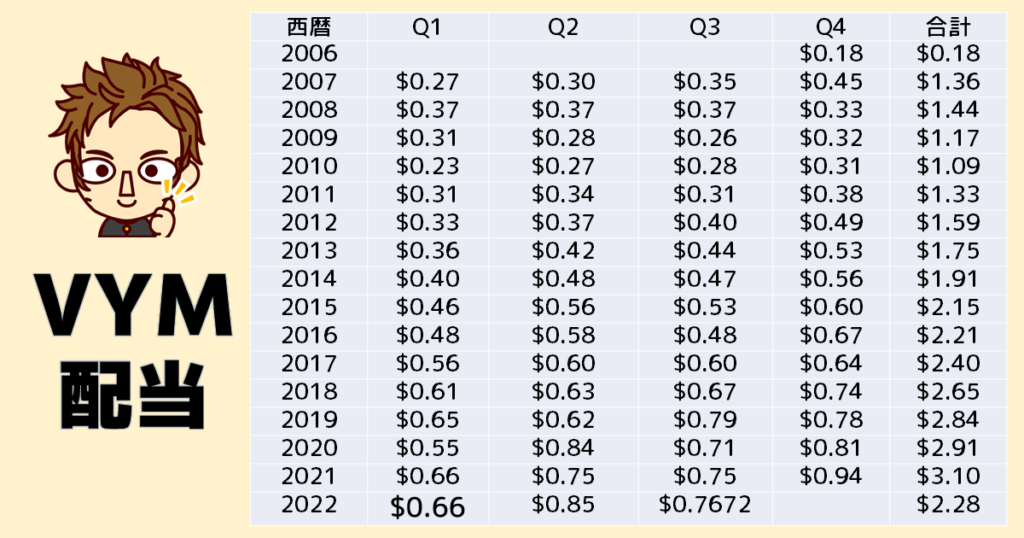
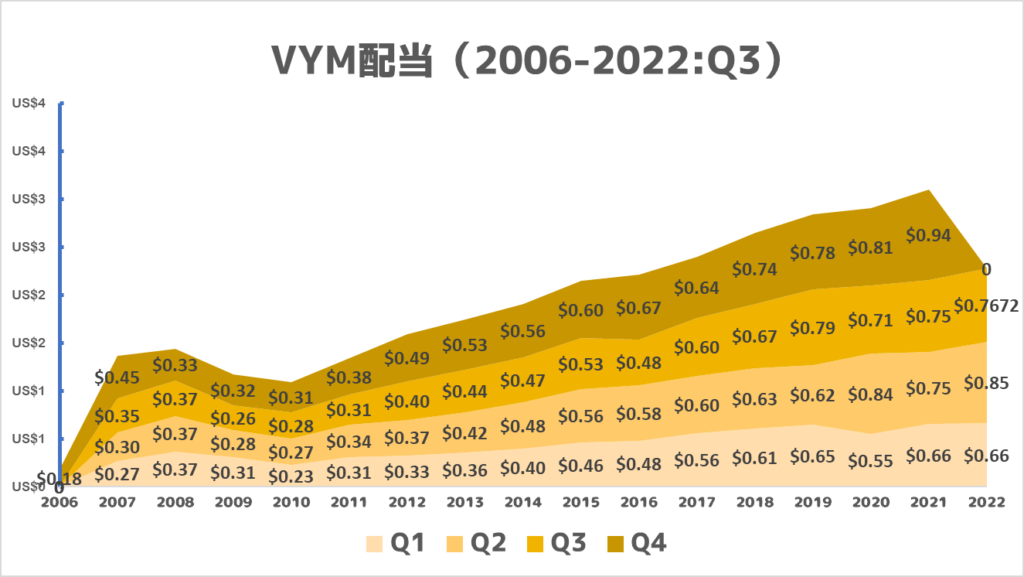
2010年から2021年にかけて増配が続いている。
これがVYMの魅力だよね。
直近のVYMの利回りは3.40%でした。(2022/6/17)
VYM構成銘柄と構成比率(2022年9月)


2022年9月の構成銘柄をすべて掲載しました。
VYMは年1回の入れ替えを行っており、個々の銘柄は個人で確認して参考程度でお願いします。
(投資は最終的に自己責任でお願いします。)
| 順位 | 構成銘柄 | 構成比率 |
|---|---|---|
| 1 | Johnson & Johnson | 3.10% |
| 2 | Exxon Mobil Corporation | 2.95% |
| 3 | JPMorgan Chase & Co. | 2.43% |
| 4 | Procter & Gamble Company | 2.41% |
| 5 | Chevron Corporation | 2.27% |
| 6 | Home Depot, Inc. | 2.18% |
| 7 | Pfizer Inc. | 1.87% |
| 8 | Eli Lilly and Company | 1.86% |
| 9 | Coca-Cola Company | 1.76% |
| 10 | PepsiCo, Inc. | 1.74% |
| 11 | AbbVie, Inc. | 1.74% |
| 12 | Bank of America Corp | 1.73% |
| 13 | Merck & Co., Inc. | 1.58% |
| 14 | Broadcom Inc. | 1.46% |
| 15 | Walmart Inc. | 1.40% |
| 16 | McDonald’s Corporation | 1.36% |
| 17 | Cisco Systems, Inc. | 1.36% |
| 18 | Verizon Communications Inc. | 1.28% |
| 19 | NextEra Energy, Inc. | 1.22% |
| 20 | Wells Fargo & Company | 1.21% |
| 21 | Comcast Corporation Class A | 1.18% |
| 22 | Texas Instruments Incorporated | 1.11% |
| 23 | QUALCOMM Incorporated | 1.08% |
| 24 | Philip Morris International Inc. | 1.08% |
| 25 | Bristol-Myers Squibb Company | 1.05% |
| 26 | United Parcel Service, Inc. Class B | 1.05% |
| 27 | Linde plc | 1.04% |
| 28 | ConocoPhillips | 1.03% |
| 29 | Raytheon Technologies Corporation | 0.98% |
| 30 | Intel Corporation | 0.95% |
| 31 | Honeywell International Inc. | 0.94% |
| 32 | CVS Health Corporation | 0.94% |
| 33 | Amgen Inc. | 0.94% |
| 34 | AT&T Inc. | 0.92% |
| 35 | Medtronic Plc | 0.86% |
| 36 | International Business Machines Corporation | 0.85% |
| 37 | Goldman Sachs Group, Inc. | 0.81% |
| 38 | Morgan Stanley | 0.79% |
| 39 | Automatic Data Processing, Inc. | 0.75% |
| 40 | BlackRock, Inc. | 0.73% |
| 41 | Lockheed Martin Corporation | 0.73% |
| 42 | Caterpillar Inc. | 0.72% |
| 43 | Starbucks Corporation | 0.71% |
| 44 | Citigroup Inc. | 0.70% |
| 45 | Mondelez International, Inc. Class A | 0.62% |
| 46 | Duke Energy Corporation | 0.60% |
| 47 | Altria Group Inc | 0.60% |
| 48 | Southern Company | 0.60% |
| 49 | U.S. Dollar | 0.59% |
| 50 | Chubb Limited | 0.58% |
| 51 | Gilead Sciences, Inc. | 0.58% |
| 52 | Target Corporation | 0.54% |
| 53 | Progressive Corporation | 0.52% |
| 54 | EOG Resources, Inc. | 0.52% |
| 55 | 3M Company | 0.52% |
| 56 | Waste Management, Inc. | 0.51% |
| 57 | CME Group Inc. Class A | 0.51% |
| 58 | Dominion Energy Inc | 0.49% |
| 59 | Blackstone Inc. | 0.48% |
| 60 | PNC Financial Services Group, Inc. | 0.48% |
| 61 | Colgate-Palmolive Company | 0.47% |
| 62 | Truist Financial Corporation | 0.46% |
| 63 | U.S. Bancorp | 0.45% |
| 64 | Illinois Tool Works Inc. | 0.44% |
| 65 | Ford Motor Company | 0.44% |
| 66 | General Dynamics Corporation | 0.41% |
| 67 | Air Products and Chemicals, Inc. | 0.41% |
| 68 | Eaton Corp. Plc | 0.40% |
| 69 | Marathon Petroleum Corporation | 0.40% |
| 70 | Schlumberger NV | 0.39% |
| 71 | Sempra Energy | 0.38% |
| 72 | American Electric Power Company, Inc. | 0.38% |
| 73 | Archer-Daniels-Midland Company | 0.36% |
| 74 | Emerson Electric Co. | 0.35% |
| 75 | Valero Energy Corporation | 0.35% |
| 76 | Devon Energy Corporation | 0.34% |
| 77 | General Mills, Inc. | 0.34% |
| 78 | MetLife, Inc. | 0.32% |
| 79 | L3Harris Technologies Inc | 0.32% |
| 80 | Phillips 66 | 0.32% |
| 81 | Exelon Corporation | 0.31% |
| 82 | Kimberly-Clark Corporation | 0.31% |
| 83 | Sysco Corporation | 0.30% |
| 84 | Williams Companies, Inc. | 0.30% |
| 85 | American International Group, Inc. | 0.30% |
| 86 | Xcel Energy Inc. | 0.30% |
| 87 | Paychex, Inc. | 0.29% |
| 88 | Travelers Companies, Inc. | 0.28% |
| 89 | Aflac Incorporated | 0.28% |
| 90 | Arthur J. Gallagher & Co. | 0.28% |
| 91 | Johnson Controls International plc | 0.27% |
| 92 | Dow, Inc. | 0.27% |
| 93 | Kinder Morgan Inc Class P | 0.27% |
| 94 | Prudential Financial, Inc. | 0.26% |
| 95 | Nucor Corporation | 0.26% |
| 96 | Consolidated Edison, Inc. | 0.25% |
| 97 | Allstate Corporation | 0.24% |
| 98 | WEC Energy Group Inc | 0.24% |
| 99 | Newmont Corporation | 0.24% |
| 100 | Hershey Company | 0.24% |
| 101 | M&T Bank Corporation | 0.24% |
| 102 | Public Service Enterprise Group Inc | 0.23% |
| 103 | Kroger Co. | 0.23% |
| 104 | Eversource Energy | 0.23% |
| 105 | HP Inc. | 0.22% |
| 106 | Bank of New York Mellon Corp | 0.22% |
| 107 | Cummins Inc. | 0.22% |
| 108 | PACCAR Inc | 0.22% |
| 109 | Ameriprise Financial, Inc. | 0.21% |
| 110 | Fastenal Company | 0.21% |
| 111 | DuPont de Nemours, Inc. | 0.21% |
| 112 | Discover Financial Services | 0.21% |
| 113 | International Flavors & Fragrances Inc. | 0.21% |
| 114 | ONEOK, Inc. | 0.20% |
| 115 | T. Rowe Price Group | 0.20% |
| 116 | Kraft Heinz Company | 0.19% |
| 117 | Corning Inc | 0.19% |
| 118 | Edison International | 0.19% |
| 119 | Apollo Global Management Inc. | 0.19% |
| 120 | Walgreens Boots Alliance, Inc. | 0.18% |
| 121 | DTE Energy Company | 0.18% |
| 122 | State Street Corporation | 0.18% |
| 123 | Coterra Energy Inc. | 0.18% |
| 124 | Ameren Corporation | 0.17% |
| 125 | Diamondback Energy, Inc. | 0.17% |
| 126 | Baker Hughes Company Class A | 0.17% |
| 127 | Entergy Corporation | 0.17% |
| 128 | Fifth Third Bancorp | 0.17% |
| 129 | FirstEnergy Corp. | 0.17% |
| 130 | Genuine Parts Company | 0.16% |
| 131 | PPL Corporation | 0.16% |
| 132 | CF Industries Holdings, Inc. | 0.16% |
| 133 | Tyson Foods, Inc. Class A | 0.16% |
| 134 | LyondellBasell Industries NV | 0.16% |
| 135 | Hartford Financial Services Group, Inc. | 0.15% |
| 136 | Regions Financial Corporation | 0.15% |
| 137 | CenterPoint Energy, Inc. | 0.14% |
| 138 | Northern Trust Corporation | 0.14% |
| 139 | Huntington Bancshares Incorporated | 0.14% |
| 140 | CMS Energy Corporation | 0.14% |
| 141 | Cardinal Health, Inc. | 0.14% |
| 142 | Principal Financial Group, Inc. | 0.14% |
| 143 | Kellogg Company | 0.13% |
| 144 | Citizens Financial Group, Inc. | 0.13% |
| 145 | Hewlett Packard Enterprise Co. | 0.13% |
| 146 | AES Corporation | 0.12% |
| 147 | KeyCorp | 0.12% |
| 148 | Synchrony Financial | 0.12% |
| 149 | Conagra Brands, Inc. | 0.12% |
| 150 | NetApp, Inc. | 0.12% |
| 151 | Atmos Energy Corporation | 0.11% |
| 152 | Darden Restaurants, Inc. | 0.11% |
| 153 | International Paper Company | 0.11% |
| 154 | Alliant Energy Corp | 0.11% |
| 155 | Evergy, Inc. | 0.11% |
| 156 | Cincinnati Financial Corporation | 0.11% |
| 157 | J.M. Smucker Company | 0.11% |
| 158 | Clorox Company | 0.11% |
| 159 | V.F. Corporation | 0.11% |
| 160 | Steel Dynamics, Inc. | 0.11% |
| 161 | Hormel Foods Corporation | 0.10% |
| 162 | C.H. Robinson Worldwide, Inc. | 0.10% |
| 163 | Best Buy Co., Inc. | 0.10% |
| 164 | Bunge Limited | 0.10% |
| 165 | Garmin Ltd. | 0.10% |
| 166 | Omnicom Group Inc | 0.10% |
| 167 | Chesapeake Energy Corporation | 0.09% |
| 168 | Packaging Corporation of America | 0.09% |
| 169 | NortonLifeLock Inc. | 0.09% |
| 170 | Seagate Technology Holdings PLC | 0.09% |
| 171 | Celanese Corporation | 0.09% |
| 172 | First Horizon Corporation | 0.09% |
| 173 | NiSource Inc | 0.09% |
| 174 | RPM International Inc. | 0.09% |
| 175 | Eastman Chemical Company | 0.08% |
| 176 | Reliance Steel & Aluminum Co. | 0.08% |
| 177 | Viatris, Inc. | 0.08% |
| 178 | Snap-on Incorporated | 0.08% |
| 179 | Equitable Holdings, Inc. | 0.08% |
| 180 | Essential Utilities, Inc. | 0.08% |
| 181 | Ares Management Corporation | 0.08% |
| 182 | Hubbell Incorporated | 0.08% |
| 183 | Interpublic Group of Companies, Inc. | 0.08% |
| 184 | Ally Financial Inc | 0.08% |
| 185 | Everest Re Group, Ltd. | 0.08% |
| 186 | Vistra Corp. | 0.08% |
| 187 | Fidelity National Financial, Inc. – FNF Group | 0.08% |
| 188 | Comerica Incorporated | 0.08% |
| 189 | Hasbro, Inc. | 0.08% |
| 190 | Williams-Sonoma, Inc. | 0.08% |
| 191 | Advance Auto Parts, Inc. | 0.08% |
| 192 | WestRock Company | 0.07% |
| 193 | Lumen Technologies, Inc. | 0.07% |
| 194 | East West Bancorp, Inc. | 0.07% |
| 195 | Paramount Global Class B | 0.07% |
| 196 | Nielsen Holdings Plc | 0.07% |
| 197 | Coca-Cola Europacific Partners plc | 0.07% |
| 198 | Campbell Soup Company | 0.07% |
| 199 | NRG Energy, Inc. | 0.07% |
| 200 | Huntington Ingalls Industries, Inc. | 0.07% |
| 201 | Tapestry, Inc. | 0.07% |
| 202 | Juniper Networks, Inc. | 0.07% |
| 203 | Molson Coors Beverage Company Class B | 0.07% |
| 204 | Watsco, Inc. | 0.07% |
| 205 | Whirlpool Corporation | 0.06% |
| 206 | Credicorp Ltd. | 0.06% |
| 207 | Pinnacle West Capital Corporation | 0.06% |
| 208 | American Financial Group, Inc. | 0.06% |
| 209 | Assurant, Inc. | 0.06% |
| 210 | UGI Corporation | 0.06% |
| 211 | Reinsurance Group of America, Incorporated | 0.06% |
| 212 | Webster Financial Corporation | 0.06% |
| 213 | Zions Bancorporation, N.A. | 0.06% |
| 214 | OGE Energy Corp. | 0.06% |
| 215 | Lincoln National Corporation | 0.06% |
| 216 | Olin Corporation | 0.06% |
| 217 | Cullen/Frost Bankers, Inc. | 0.06% |
| 218 | Unum Group | 0.06% |
| 219 | Franklin Resources, Inc. | 0.05% |
| 220 | H&R Block, Inc. | 0.05% |
| 221 | Organon & Co. | 0.05% |
| 222 | Autoliv Inc. | 0.05% |
| 223 | Newell Brands Inc | 0.05% |
| 224 | Carlyle Group Inc | 0.05% |
| 225 | Jefferies Financial Group Inc. | 0.05% |
| 226 | Prosperity Bancshares, Inc.(R) | 0.05% |
| 227 | Polaris Inc. | 0.05% |
| 228 | National Fuel Gas Company | 0.05% |
| 229 | Old Republic International Corporation | 0.04% |
| 230 | Synovus Financial Corp. | 0.04% |
| 231 | Invesco Ltd. | 0.04% |
| 232 | Sonoco Products Company | 0.04% |
| 233 | MDU Resources Group Inc | 0.04% |
| 234 | SouthState Corporation | 0.04% |
| 235 | Popular, Inc. | 0.04% |
| 236 | Ingredion Incorporated | 0.04% |
| 237 | Murphy Oil Corporation | 0.04% |
| 238 | Western Union Company | 0.04% |
| 239 | Glacier Bancorp, Inc. | 0.04% |
| 240 | Huntsman Corporation | 0.04% |
| 241 | First American Financial Corporation | 0.04% |
| 242 | IDACORP, Inc. | 0.04% |
| 243 | nVent Electric plc | 0.04% |
| 244 | DT Midstream, Inc. | 0.04% |
| 245 | Chemours Co. | 0.04% |
| 246 | National Instruments Corporation | 0.04% |
| 247 | Southwest Gas Holdings, Inc. | 0.04% |
| 248 | Flowers Foods, Inc. | 0.04% |
| 249 | Leggett & Platt, Incorporated | 0.04% |
| 250 | Perrigo Co. Plc | 0.04% |
| 251 | Valley National Bancorp | 0.04% |
| 252 | Macy’s Inc | 0.04% |
| 253 | United Bankshares, Inc. | 0.04% |
| 254 | Old National Bancorp | 0.04% |
| 255 | Commercial Metals Company | 0.04% |
| 256 | Black Hills Corporation | 0.04% |
| 257 | TEGNA, Inc. | 0.03% |
| 258 | Bank OZK | 0.03% |
| 259 | Cadence Bank | 0.03% |
| 260 | Portland General Electric Company | 0.03% |
| 261 | Hanover Insurance Group, Inc. | 0.03% |
| 262 | New York Community Bancorp, Inc. | 0.03% |
| 263 | Home BancShares, Inc. | 0.03% |
| 264 | Crane Holdings, Co. | 0.03% |
| 265 | MGIC Investment Corporation | 0.03% |
| 266 | Helmerich & Payne, Inc. | 0.03% |
| 267 | Sirius XM Holdings, Inc. | 0.03% |
| 268 | Hawaiian Electric Industries, Inc. | 0.03% |
| 269 | New Jersey Resources Corporation | 0.03% |
| 270 | RLI Corp. | 0.03% |
| 271 | Avnet, Inc. | 0.03% |
| 272 | F.N.B. Corporation | 0.03% |
| 273 | ONE Gas, Inc. | 0.03% |
| 274 | Ralph Lauren Corporation Class A | 0.03% |
| 275 | Hancock Whitney Corporation | 0.03% |
| 276 | Premier Inc. Class A | 0.03% |
| 277 | Axis Capital Holdings Limited | 0.03% |
| 278 | South Jersey Industries, Inc. | 0.03% |
| 279 | SLM Corp | 0.03% |
| 280 | OneMain Holdings, Inc. | 0.03% |
| 281 | PNM Resources, Inc. | 0.03% |
| 282 | Southern Copper Corporation | 0.03% |
| 283 | Houlihan Lokey, Inc. Class A | 0.03% |
| 284 | Cabot Corporation | 0.03% |
| 285 | Flowserve Corporation | 0.03% |
| 286 | Avient Corporation | 0.03% |
| 287 | Timken Company | 0.03% |
| 288 | Umpqua Holdings Corporation | 0.03% |
| 289 | ManpowerGroup Inc. | 0.03% |
| 290 | Equitrans Midstream Corporation | 0.03% |
| 291 | Ryder System, Inc. | 0.03% |
| 292 | Triton International Ltd. Class A | 0.03% |
| 293 | MSC Industrial Direct Co., Inc. Class A | 0.03% |
| 294 | Radian Group Inc. | 0.03% |
| 295 | Kohl’s Corporation | 0.03% |
| 296 | Independent Bank Corp. | 0.03% |
| 297 | United Community Banks, Inc. | 0.03% |
| 298 | Spire Inc. | 0.03% |
| 299 | Travel + Leisure Co. | 0.03% |
| 300 | CVB Financial Corp. | 0.03% |
| 301 | Evercore Inc. Class A | 0.03% |
| 302 | Avangrid, Inc. | 0.03% |
| 303 | Community Bank System, Inc. | 0.03% |
| 304 | Lazard Ltd Class A | 0.02% |
| 305 | GATX Corporation | 0.02% |
| 306 | Antero Midstream Corp. | 0.02% |
| 307 | ALLETE, Inc. | 0.02% |
| 308 | Sensient Technologies Corporation | 0.02% |
| 309 | First Hawaiian, Inc. | 0.02% |
| 310 | Wendy’s Company | 0.02% |
| 311 | Penske Automotive Group, Inc. | 0.02% |
| 312 | Janus Henderson Group PLC | 0.02% |
| 313 | Assured Guaranty Ltd. | 0.02% |
| 314 | Otter Tail Corporation | 0.02% |
| 315 | Pacific Premier Bancorp, Inc. | 0.02% |
| 316 | Walker & Dunlop, Inc. | 0.02% |
| 317 | PacWest Bancorp | 0.02% |
| 318 | ABM Industries Incorporated | 0.02% |
| 319 | Bank of Hawaii Corp | 0.02% |
| 320 | Foot Locker, Inc. | 0.02% |
| 321 | Clearway Energy, Inc. Class C | 0.02% |
| 322 | Hanesbrands Inc. | 0.02% |
| 323 | BankUnited, Inc. | 0.02% |
| 324 | FirstCash Holdings, Inc. | 0.02% |
| 325 | Cathay General Bancorp | 0.02% |
| 326 | Associated Banc-Corp | 0.02% |
| 327 | Federated Hermes, Inc. Class B | 0.02% |
| 328 | ZIM Integrated Shipping Services Ltd. | 0.02% |
| 329 | Simmons First National Corporation Class A | 0.02% |
| 330 | Avista Corporation | 0.02% |
| 331 | Kemper Corp | 0.02% |
| 332 | LCI Industries | 0.02% |
| 333 | NorthWestern Corporation | 0.02% |
| 334 | MGE Energy, Inc. | 0.02% |
| 335 | First Bancorp | 0.02% |
| 336 | Scotts Miracle-Gro Company Class A | 0.02% |
| 337 | Moelis & Co. Class A | 0.02% |
| 338 | BOK Financial Corporation | 0.02% |
| 339 | Fulton Financial Corporation | 0.02% |
| 340 | Spectrum Brands Holdings, Inc. | 0.02% |
| 341 | Cracker Barrel Old Country Store, Inc. | 0.02% |
| 342 | Independent Bank Group, Inc. | 0.02% |
| 343 | Patterson Companies Incorporated | 0.02% |
| 344 | Atlantic Union Bankshares Corporation | 0.02% |
| 345 | Columbia Banking System, Inc. | 0.02% |
| 346 | Jackson Financial Incorporation Class A | 0.02% |
| 347 | Cogent Communications Holdings Inc | 0.02% |
| 348 | Virtu Financial, Inc. Class A | 0.02% |
| 349 | First Merchants Corporation | 0.02% |
| 350 | BancFirst Corporation | 0.02% |
| 351 | Atlantica Sustainable Infrastructure plc | 0.02% |
| 352 | CNO Financial Group, Inc. | 0.02% |
| 353 | WesBanco, Inc. | 0.02% |
| 354 | Kontoor Brands, Inc. | 0.02% |
| 355 | Washington Federal, Inc. | 0.01% |
| 356 | Scorpio Tankers Inc. | 0.01% |
| 357 | Nu Skin Enterprises, Inc. Class A | 0.01% |
| 358 | Kennedy-Wilson Holdings, Inc. | 0.01% |
| 359 | First Financial Bancorp. | 0.01% |
| 360 | Banner Corporation | 0.01% |
| 361 | McGrath RentCorp | 0.01% |
| 362 | Artisan Partners Asset Management, Inc. Class A | 0.01% |
| 363 | Dana Incorporated | 0.01% |
| 364 | John Wiley & Sons, Inc. Class A | 0.01% |
| 365 | Kennametal Inc. | 0.01% |
| 366 | Trustmark Corporation | 0.01% |
| 367 | Xerox Holdings Corporation | 0.01% |
| 368 | Stock Yards Bancorp, Inc. | 0.01% |
| 369 | TowneBank | 0.01% |
| 370 | Heartland Financial USA, Inc. | 0.01% |
| 371 | Energizer Holdings, Inc. | 0.01% |
| 372 | Cohen & Steers, Inc. | 0.01% |
| 373 | Gap, Inc. | 0.01% |
| 374 | Renasant Corporation | 0.01% |
| 375 | Navient Corp | 0.01% |
| 376 | International Game Technology PLC | 0.01% |
| 377 | M.D.C. Holdings, Inc. | 0.01% |
| 378 | American Eagle Outfitters, Inc. | 0.01% |
| 379 | SJW Group | 0.01% |
| 380 | Tronox Holdings Plc | 0.01% |
| 381 | Greif Inc Class A | 0.01% |
| 382 | Provident Financial Services, Inc. | 0.01% |
| 383 | Northwest Bancshares, Inc. | 0.01% |
| 384 | Oxford Industries, Inc. | 0.01% |
| 385 | Sandy Spring Bancorp, Inc. | 0.01% |
| 386 | Jack in the Box Inc. | 0.01% |
| 387 | Hope Bancorp, Inc. | 0.01% |
| 388 | Worthington Industries, Inc. | 0.01% |
| 389 | Northwest Natural Holding Co. | 0.01% |
| 390 | Telephone and Data Systems, Inc. | 0.01% |
| 391 | NBT Bancorp Inc. | 0.01% |
| 392 | Bank of N.T. Butterfield & Son Limited (The) | 0.01% |
| 393 | Carpenter Technology Corporation | 0.01% |
| 394 | Wolverine World Wide, Inc. | 0.01% |
| 395 | ADT, Inc. | 0.01% |
| 396 | Reynolds Consumer Products Inc | 0.01% |
| 397 | Eagle Bancorp, Inc. | 0.01% |
| 398 | B&G Foods, Inc. | 0.01% |
| 399 | Strategic Education, Inc. | 0.01% |
| 400 | Horace Mann Educators Corporation | 0.01% |
| 401 | Westamerica Bancorporation | 0.01% |
| 402 | Medifast, Inc. | 0.01% |
| 403 | Vector Group Ltd. | 0.01% |
| 404 | Rent-A-Center Inc | 0.01% |
| 405 | HNI Corporation | 0.01% |
| 406 | Granite Construction Incorporated | 0.01% |
| 407 | Virtus Investment Partners, Inc. | 0.01% |
| 408 | Weis Markets, Inc. | 0.01% |
| 409 | Berkshire Hills Bancorp, Inc. | 0.01% |
| 410 | Mativ Holdings, Inc. | 0.01% |
2022年9月17日時点の構成銘柄です。最新情報が気になる人はホームページで確認しよう。
どのくらい理解しておいたらいい?


410銘柄は覚える必要はないよ。
上位10銘柄20%、30銘柄で46.51%。
気になる人は上位30銘柄を抑えておこう。
非常に分散していることがよくわかるね
(よく計算したね・・・・)
まとめ


・株価、配当は安定感がある、不況に強い
・高配当(インカムゲイン)狙いの人には非常におすすめのETFです
・キャピタルゲインを狙う人はインデックス投資信託やS&P500のETFの方をおすすめします
・投資手法によるが、高配当ETFは加える方が家計の安定性が高まる
雑談(サラリーマン投資家ぐりっと目線)
総資産1000万家計のぐりっと、いくらVYMに投資している?
VYMは138株(非課税70株、NISA68株)、総資産/VYMは10-12%を投資しています。
今後も継続してVYMを購入予定です。


長期投資の醍醐味のような銘柄。
配当が楽しみだね。
2022年12月(Q4)が非常に楽しみだね。
今回の記事は2022年9月の3Qの配当金について解説しました。
VYMは配当利回りが高く有力な投資先ですが、VTについても抑えておく必要があります。
VTについても解説していますがのでぜひ、こちらの記事も併せて読んでみてください。


関連記事:あわせて読みたい


コメント