本と投資は人を成長させるをコンセプトにしているブロガーであり、40代サラリーマン投資家ぐりっとです。
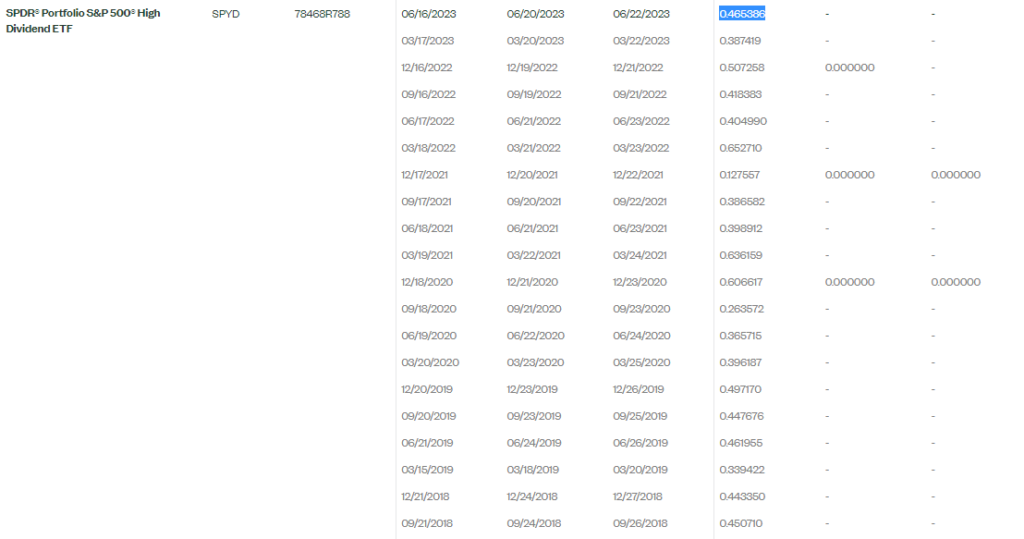
SPYDの2023年Q2(6月)の配当金が発表されました。
2023年Q2(6月)の配当実績は$0.465386でした。
2022年Q2は$0.404990ですので、前年同期比より14.85%。
2023年Q1の大幅減配を取り戻すまではいきませんが、一応、無難な着地となりました。
支払い日2023年6月22日です。
増配率は、前期から今期にかけての配当増加の割合を示す指標です。以下の式で計算できます。
増配率 = ((今期の配当 – 前期の配当) / 前期の配当) × 100%
増配率 = ((0.465386 – 0.404990) / 0.404990) * 100計算すると、増配率は14.85%となります。
今回の情報はSPYDウエイブサイトより引用しています。

参考サイト
SPYD の投資成績を詳しく知りたい人はサイトを参考にしてください。

2023年Q2の成績一覧表 あわせて読みたい


SPYD 基礎知識

銘柄名:SPDR®ポートフォリオS&P500®高配当ETF
銘柄構成数:78(ブログの後半にすべて記載)
運用会社:State Stree(ステートストリート)社
設定日:2015年10月21日
経費率:年率0.07%
配当利回り:4.85%(2023/6/16)
ベンチマーク:S&P500高配当指数
・年初来トータルリターン:-10.27%(2023/6/16)
SPYD概要 株価・配当金・配当利回り

 ぐりっと
ぐりっとSPYDは動きが読みにくいので注意が必要。
配当利回りは非常に高いけれど、注意が必要だよ。
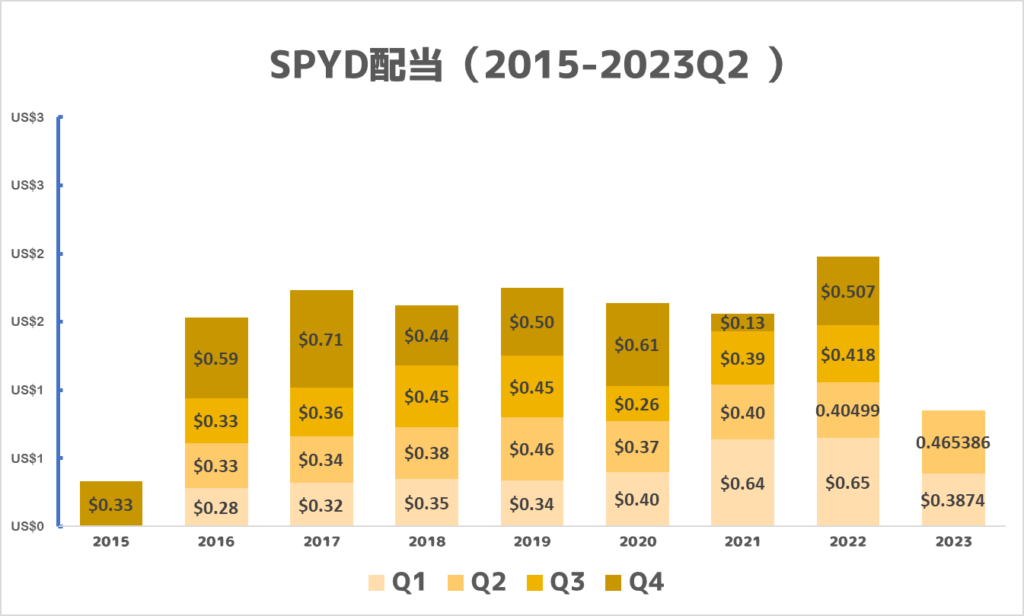
SPYDの配当実績を確認してみよう
| 西暦 | Q1 | Q2 | Q3 | Q4 | 合計 | 増配率 |
| 2015 | $0.33 | $0.33 | ||||
| 2016 | $0.28 | $0.33 | $0.33 | $0.59 | $1.51 | 357.6% |
| 2017 | $0.32 | $0.34 | $0.36 | $0.71 | $1.74 | 15.2% |
| 2018 | $0.35 | $0.38 | $0.45 | $0.44 | $1.62 | -6.9% |
| 2019 | $0.34 | $0.46 | $0.45 | $0.50 | $1.75 | 8.0% |
| 2020 | $0.40 | $0.37 | $0.26 | $0.61 | $1.63 | -6.9% |
| 2021 | $0.64 | $0.40 | $0.39 | $0.13 | $1.55 | -4.9% |
| 2022 | $0.65 | $0.40499 | $0.418 | $0.507 | $1.98 | 27.8% |
| 2023 | $0.3874 | $0.465386 |


SPYD 構成銘柄


| 順位 | 構成銘柄 | 構成比率 |
| 1 | Darden Restaurants, Inc. | 1.64% |
| 2 | Ford Motor Company | 1.59% |
| 3 | Pinnacle West Capital Corporation | 1.58% |
| 4 | Interpublic Group of Companies, Inc. | 1.57% |
| 5 | AvalonBay Communities, Inc. | 1.57% |
| 6 | Omnicom Group Inc | 1.57% |
| 7 | Iron Mountain, Inc. | 1.55% |
| 8 | Essex Property Trust, Inc. | 1.52% |
| 9 | UDR, Inc. | 1.51% |
| 10 | Equity Residential | 1.51% |
| 11 | Southern Company | 1.51% |
| 12 | Seagate Technology Holdings PLC | 1.50% |
| 13 | NRG Energy, Inc. | 1.49% |
| 14 | Stanley Black & Decker, Inc. | 1.45% |
| 15 | Public Service Enterprise Group Inc | 1.45% |
| 16 | Packaging Corporation of America | 1.44% |
| 17 | Edison International | 1.43% |
| 18 | Kimberly-Clark Corporation | 1.43% |
| 19 | Digital Realty Trust, Inc. | 1.41% |
| 20 | Altria Group, Inc. | 1.40% |
| 21 | LyondellBasell Industries NV | 1.39% |
| 22 | Hasbro, Inc. | 1.38% |
| 23 | International Business Machines Corporation | 1.38% |
| 24 | Williams Companies, Inc. | 1.37% |
| 25 | Evergy, Inc. | 1.37% |
| 26 | Whirlpool Corporation | 1.36% |
| 27 | VICI Properties Inc | 1.36% |
| 28 | T. Rowe Price Group | 1.35% |
| 29 | Entergy Corporation | 1.35% |
| 30 | FirstEnergy Corp. | 1.34% |
| 31 | Extra Space Storage Inc. | 1.34% |
| 32 | Citigroup Inc. | 1.34% |
| 33 | Conagra Brands, Inc. | 1.34% |
| 34 | リージェンシー センターズ コーポレーション | 1.32% |
| 35 | AbbVie, Inc. | 1.32% |
| 36 | Morgan Stanley | 1.31% |
| 37 | Kraft Heinz Company | 1.31% |
| 38 | Philip Morris International Inc. | 1.31% |
| 39 | Best Buy Co., Inc. | 1.31% |
| 40 | Realty Income Corporation | 1.30% |
| 41 | Kinder Morgan Inc Class P | 1.30% |
| 42 | Ventas, Inc. | 1.30% |
| 43 | Dow, Inc. | 1.29% |
| 44 | Franklin Resources, Inc. | 1.28% |
| 45 | Duke Energy Corporation | 1.28% |
| 46 | Phillips 66 | 1.28% |
| 47 | Invesco Ltd. | 1.28% |
| 48 | 3M Company | 1.26% |
| 49 | Simon Property Group, Inc. | 1.26% |
| 50 | Verizon Communications Inc. | 1.26% |
| 51 | Kimco Realty Corporation | 1.26% |
| 52 | Walgreens Boots Alliance, Inc. | 1.25% |
| 53 | ONEOK, Inc. | 1.24% |
| 54 | Amcor PLC | 1.23% |
| 55 | International Paper Company | 1.23% |
| 56 | Federal Realty Investment Trust | 1.22% |
| 57 | Prudential Financial, Inc. | 1.21% |
| 58 | Viatris, Inc. | 1.20% |
| 59 | Dominion Energy Inc | 1.20% |
| 60 | AT&T Inc. | 1.18% |
| 61 | PNC Financial Services Group, Inc. | 1.14% |
| 62 | Regions Financial Corporation | 1.13% |
| 63 | Newmont Corporation | 1.13% |
| 64 | Crown Castle Inc. | 1.12% |
| 65 | Boston Properties, Inc. | 1.09% |
| 66 | Healthpeak Properties, Inc. | 1.09% |
| 67 | Fifth Third Bancorp | 1.05% |
| 68 | Huntington Bancshares Incorporated | 1.05% |
| 69 | Lincoln National Corp | 1.05% |
| 70 | U.S. Bancorp | 0.98% |
| 71 | Truist Financial Corporation | 0.94% |
| 72 | Citizens Financial Group, Inc. | 0.92% |
| 73 | Organon & Co. | 0.92% |
| 74 | V.F. Corporation | 0.91% |
| 75 | Comerica Incorporated | 0.83% |
| 76 | KeyCorp | 0.79% |
| 77 | Newell Brands Inc | 0.76% |
| 78 | Advance Auto Parts, Inc. | 0.68% |
| 79 | State Street Institutional Liquid Reserves Fund | 0.40% |
| 80 | U.S. Dollar | 0.02% |
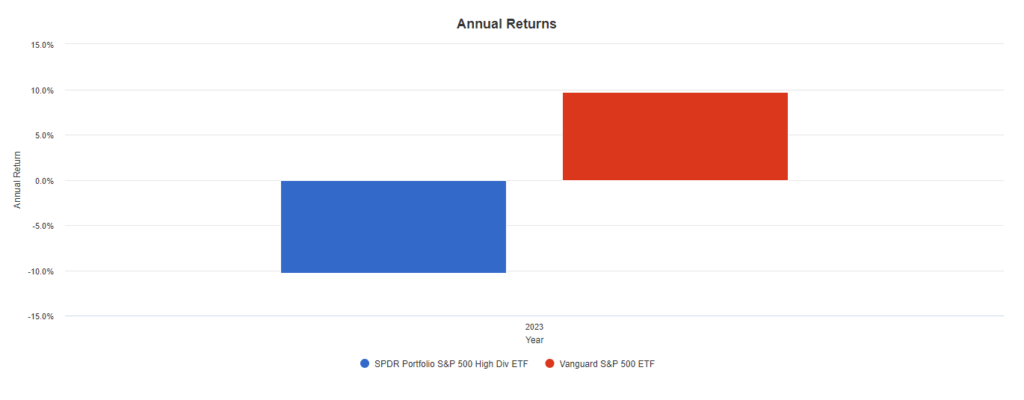
SPYDとS&P500比較(2023年Q2)


VOO+9.71%に対して、SPYDは-10.29%と大差がついています。
まとめ


・2023年Q2(6月)の配当実績は$0.465386。(2022年Q2は$0.404990、前年同期比より14.85%)
・VOOと比較すると2023年は高配当ETFは大差で惨敗。
・ディフェンシブ銘柄が株価を引き下げている印象。


雑談(サラリーマン投資家ぐりっと目線)
SPYDはお気に入りのETFの1つです。
株価だけでなく配当は魅力的です。
SBI証券ではSPYDは手数料がかからず購入することができるため、積極的に購入していました。
増配率はVYMと比較すると安定しておらず、今後も一喜一憂するETFになりそうです。
中長期的にはVYMを主力してSPYDをサブ銘柄として高配当ETFを展開していく予定です。
2023年Q2の成績一覧表 あわせて読みたい


コメント