以前からVIGにAAPLが追加されるのではないかと噂になっていました。
私もそれが近い将来実現すると思っていたので、それまでにVIGを買ったほうが良いのではないかとTwitterでつぶやいたことがあります。
前回の2023年Q1の配当が発表された際に確認しましたが、AAPLが追加されておらず、Q2まで持ち越すと思っていた矢先のことです。
VIGを確認するとAAPLが加わっていることに気づきました。
今回は、VIGの概要、2023年Q1の際の銘柄構成を比較、2022年のセクター別の比較しました。

VIG 概要

銘柄名:Vanguard Dividend Appreciation ETF
銘柄構成数:314
運用会社:バンガード社
設定日:2006年4月21日
経費率:年率0.06%
配当利回り
ベンチマーク:MSCI USインベスタブル・マーケット・エネルギー・インデックス
1年トータルリターン:6.04%
3年トータルリターン:11.21%
5年トータルリターン:10.53%
3月後半からVIGのチャートは上昇トレンドを形成しています。
もしからしたらAPPLが加わった効果かもしれませんね。
VIGの構成銘柄【トップ100】

AAPLがVIGに加わったことを確認しました。
今回はわかりやすいように2023年Q1の配当利回りを確認した際を旧構成銘柄、2023年4月24日のAAPLが加わった場合を比較しました。
AAPLは4.25%と大きく構成銘柄が変わっています。
AAPLにMSFTを加えると構成銘柄の合計8.72%になります。
VIGの比率がこの2銘柄によって、バランスよくなったような気がしますが、これまで以上に影響を与えそうですね。
| 順位 | 旧構成銘柄(2023/3/24) | 構成 比率 | 新構成銘柄(2023/4/24) | 構成 比率 |
| 1 | UnitedHealth Group Incorporated | 3.71% | Microsoft Corporation | 4.47% |
| 2 | Microsoft Corporation | 3.57% | Apple Inc. | 4.25% |
| 3 | JPMorgan Chase & Co. | 3.51% | Exxon Mobil Corporation | 3.28% |
| 4 | Johnson & Johnson | 3.34% | UnitedHealth Group Incorporated | 3.20% |
| 5 | Visa Inc. Class A | 2.90% | Johnson & Johnson | 2.94% |
| 6 | Procter & Gamble Company | 2.74% | JPMorgan Chase & Co. | 2.77% |
| 7 | Home Depot, Inc. | 2.56% | Procter & Gamble Company | 2.56% |
| 8 | Mastercard Incorporated Class A | 2.53% | Visa Inc. Class A | 2.54% |
| 9 | Broadcom Inc. | 2.00% | Mastercard Incorporated Class A | 2.24% |
| 10 | PepsiCo, Inc. | 1.99% | Home Depot, Inc. | 2.19% |
| 11 | Coca-Cola Company | 1.93% | Merck & Co., Inc. | 1.96% |
| 12 | Costco Wholesale Corporation | 1.78% | Broadcom Inc. | 1.88% |
| 13 | Walmart Inc. | 1.68% | PepsiCo, Inc. | 1.82% |
| 14 | Cisco Systems, Inc. | 1.66% | Coca-Cola Company | 1.75% |
| 15 | McDonald’s Corporation | 1.61% | Costco Wholesale Corporation | 1.60% |
| 16 | Abbott Laboratories | 1.48% | Cisco Systems, Inc. | 1.56% |
| 17 | Linde plc | 1.44% | Walmart Inc. | 1.51% |
| 18 | Accenture Plc Class A | 1.39% | McDonald’s Corporation | 1.49% |
| 19 | Comcast Corporation Class A | 1.35% | Accenture Plc Class A | 1.31% |
| 20 | Texas Instruments Incorporated | 1.30% | Abbott Laboratories | 1.28% |
| 21 | NIKE, Inc. Class B | 1.25% | Linde plc | 1.27% |
| 22 | Bristol-Myers Squibb Company | 1.24% | Texas Instruments Incorporated | 1.22% |
| 23 | NextEra Energy, Inc. | 1.18% | Comcast Corporation Class A | 1.19% |
| 24 | QUALCOMM Incorporated | 1.15% | NIKE, Inc. Class B | 1.12% |
| 25 | Oracle Corporation | 1.15% | NextEra Energy, Inc. | 1.11% |
| 26 | United Parcel Service, Inc. Class B | 1.11% | Bristol-Myers Squibb Company | 1.07% |
| 27 | Lowe’s Companies, Inc. | 1.09% | QUALCOMM Incorporated | 1.04% |
| 28 | Honeywell International Inc. | 1.08% | Oracle Corporation | 1.04% |
| 29 | Union Pacific Corporation | 1.07% | United Parcel Service, Inc. Class B | 1.03% |
| 30 | Caterpillar Inc. | 1.04% | Honeywell International Inc. | 0.93% |
| 31 | Starbucks Corporation | 1.00% | Intuit Inc. | 0.91% |
| 32 | Goldman Sachs Group, Inc. | 0.99% | Lowe’s Companies, Inc. | 0.90% |
| 33 | Intuit Inc. | 0.96% | Union Pacific Corporation | 0.90% |
| 34 | S&P Global, Inc. | 0.95% | Starbucks Corporation | 0.87% |
| 35 | Elevance Health, Inc. | 0.94% | Caterpillar Inc. | 0.86% |
| 36 | Lockheed Martin Corporation | 0.93% | S&P Global, Inc. | 0.83% |
| 37 | Medtronic Plc | 0.92% | Goldman Sachs Group, Inc. | 0.80% |
| 38 | BlackRock, Inc. | 0.86% | Lockheed Martin Corporation | 0.80% |
| 39 | Analog Devices, Inc. | 0.81% | Elevance Health, Inc. | 0.80% |
| 40 | Automatic Data Processing, Inc. | 0.76% | Medtronic Plc | 0.78% |
| 41 | Stryker Corporation | 0.74% | Analog Devices, Inc. | 0.74% |
| 42 | Chubb Limited | 0.73% | BlackRock, Inc. | 0.73% |
| 43 | Marsh & McLennan Companies, Inc. | 0.67% | Stryker Corporation | 0.70% |
| 44 | Target Corporation | 0.66% | Automatic Data Processing, Inc. | 0.67% |
| 45 | Eaton Corp. Plc | 0.58% | Marsh & McLennan Companies, Inc. | 0.60% |
| 46 | Northrop Grumman Corp. | 0.57% | Chubb Limited | 0.58% |
| 47 | Becton, Dickinson and Company | 0.56% | Zoetis, Inc. Class A | 0.56% |
| 48 | CME Group Inc. Class A | 0.56% | Target Corporation | 0.55% |
| 49 | Illinois Tool Works Inc. | 0.54% | Becton, Dickinson and Company | 0.51% |
| 50 | Aon Plc Class A | 0.54% | CME Group Inc. Class A | 0.50% |
| 51 | PNC Financial Services Group, Inc. | 0.53% | Eaton Corp. Plc | 0.49% |
| 52 | CSX Corporation | 0.53% | Illinois Tool Works Inc. | 0.49% |
| 53 | Air Products and Chemicals, Inc. | 0.53% | Northrop Grumman Corp. | 0.48% |
| 54 | Humana Inc. | 0.52% | Aon Plc Class A | 0.47% |
| 55 | Truist Financial Corporation | 0.52% | Air Products and Chemicals, Inc. | 0.46% |
| 56 | Colgate-Palmolive Company | 0.51% | CSX Corporation | 0.46% |
| 57 | Waste Management, Inc. | 0.47% | Colgate-Palmolive Company | 0.46% |
| 58 | Activision Blizzard, Inc. | 0.45% | Humana Inc. | 0.45% |
| 59 | KLA Corporation | 0.45% | Waste Management, Inc. | 0.44% |
| 60 | Sherwin-Williams Company | 0.44% | KLA Corporation | 0.41% |
| 61 | General Dynamics Corporation | 0.43% | Sherwin-Williams Company | 0.38% |
| 62 | McKesson Corporation | 0.42% | Emerson Electric Co. | 0.37% |
| 63 | Emerson Electric Co. | 0.41% | General Dynamics Corporation | 0.37% |
| 64 | Amphenol Corporation Class A | 0.38% | PNC Financial Services Group, Inc. | 0.37% |
| 65 | Moody’s Corporation | 0.38% | McKesson Corporation | 0.37% |
| 66 | Roper Technologies, Inc. | 0.38% | Amphenol Corporation Class A | 0.35% |
| 67 | Nucor Corporation | 0.38% | Moody’s Corporation | 0.35% |
| 68 | Microchip Technology Incorporated | 0.37% | Motorola Solutions, Inc. | 0.35% |
| 69 | Travelers Companies, Inc. | 0.37% | Sempra Energy | 0.34% |
| 70 | Motorola Solutions, Inc. | 0.37% | Roper Technologies, Inc. | 0.34% |
| 71 | Archer-Daniels-Midland Company | 0.36% | Microchip Technology Incorporated | 0.33% |
| 72 | TE Connectivity Ltd. | 0.34% | Archer-Daniels-Midland Company | 0.32% |
| 73 | L3Harris Technologies Inc | 0.34% | TE Connectivity Ltd. | 0.30% |
| 74 | Ecolab Inc. | 0.33% | Ecolab Inc. | 0.30% |
| 75 | Arthur J. Gallagher & Co. | 0.33% | Arthur J. Gallagher & Co. | 0.29% |
| 76 | Aflac Incorporated | 0.33% | Travelers Companies, Inc. | 0.29% |
| 77 | Bank of New York Mellon Corp | 0.32% | Cintas Corporation | 0.29% |
| 78 | Sysco Corporation | 0.32% | Nucor Corporation | 0.29% |
| 79 | Cintas Corporation | 0.31% | Sysco Corporation | 0.28% |
| 80 | Ameriprise Financial, Inc. | 0.31% | MetLife, Inc. | 0.28% |
| 81 | Paychex, Inc. | 0.30% | Hershey Company | 0.27% |
| 82 | Xcel Energy Inc. | 0.29% | L3Harris Technologies Inc | 0.27% |
| 83 | Hershey Company | 0.29% | Xcel Energy Inc. | 0.27% |
| 84 | Allstate Corporation | 0.29% | Paychex, Inc. | 0.27% |
| 85 | Cummins Inc. | 0.29% | Aflac Incorporated | 0.26% |
| 86 | Rockwell Automation, Inc. | 0.28% | Rockwell Automation, Inc. | 0.24% |
| 87 | State Street Corporation | 0.27% | Cummins Inc. | 0.24% |
| 88 | Discover Financial Services | 0.26% | Bank of New York Mellon Corp | 0.24% |
| 89 | PPG Industries, Inc. | 0.26% | Ameriprise Financial, Inc. | 0.24% |
| 90 | W.W. Grainger, Inc. | 0.25% | ResMed Inc. | 0.23% |
| 91 | Albemarle Corporation | 0.25% | PPG Industries, Inc. | 0.23% |
| 92 | Fastenal Company | 0.25% | W.W. Grainger, Inc. | 0.22% |
| 93 | WEC Energy Group Inc | 0.23% | Fastenal Company | 0.22% |
| 94 | HP Inc. | 0.23% | WEC Energy Group Inc | 0.22% |
| 95 | Vanguard Cash Management Market Liquidity Fund | 0.22% | Allstate Corporation | 0.21% |
| 96 | Corning Inc | 0.22% | American Water Works Company, Inc. | 0.20% |
| 97 | Republic Services, Inc. | 0.22% | Republic Services, Inc. | 0.20% |
| 98 | Eversource Energy | 0.22% | State Street Corporation | 0.20% |
| 99 | Tractor Supply Company | 0.21% | Eversource Energy | 0.20% |
| 100 | American Water Works Company, Inc. | 0.21% | Discover Financial Services | 0.20% |

 ぐりっと
ぐりっと次にセクター別の比率の変化をみていこう。
残念ですが2023年3月のバンガード社の情報は残っていなかったで、2022年9月のデータと比べてみました。
2022年とセクター別の変化


VIG のセクター別(2022/9/29)


VIG のセクター別(2023/4/24)


昨年度比較して
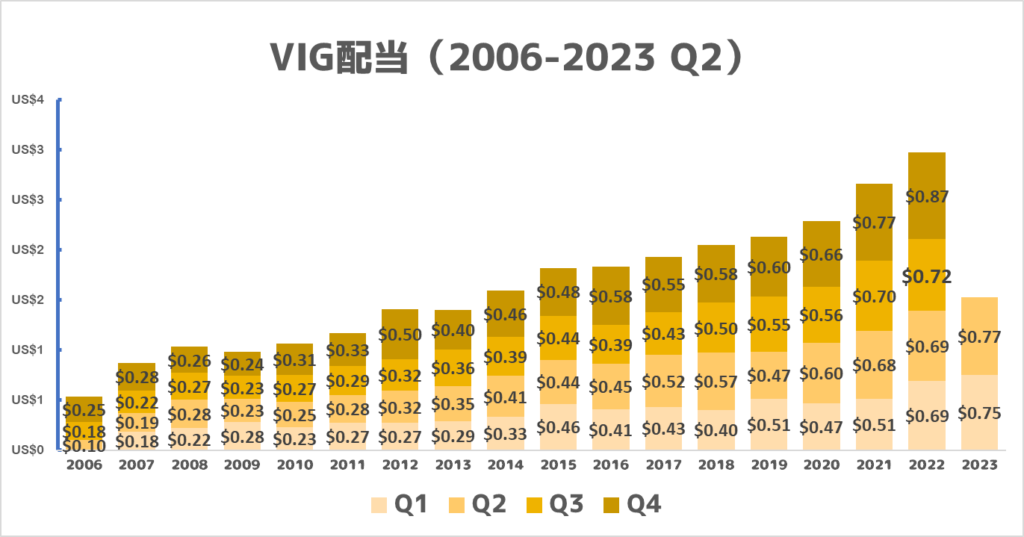
最後にVIGの配当実績について確認しよう。
配当実績


過去にVIGの配当実績を記事にしています。
詳細はそちらでご確認下さい。


| Q1 | Q2 | Q3 | Q4 | Annual | 増配率 | |
| 2006 | $0.10 | $0.18 | $0.25 | $0.50 | ||
| 2007 | $0.18 | $0.19 | $0.22 | $0.28 | $0.87 | 74.0% |
| 2008 | $0.22 | $0.28 | $0.27 | $0.26 | $1.03 | 18.4% |
| 2009 | $0.28 | $0.23 | $0.23 | $0.24 | $0.98 | -4.9% |
| 2010 | $0.23 | $0.25 | $0.27 | $0.31 | $1.05 | 7.1% |
| 2011 | $0.27 | $0.28 | $0.29 | $0.33 | $1.17 | 11.4% |
| 2012 | $0.27 | $0.32 | $0.32 | $0.50 | $1.41 | 20.5% |
| 2013 | $0.29 | $0.35 | $0.36 | $0.40 | $1.39 | -1.4% |
| 2014 | $0.33 | $0.41 | $0.39 | $0.46 | $1.59 | 14.4% |
| 2015 | $0.46 | $0.44 | $0.44 | $0.48 | $1.82 | 14.5% |
| 2016 | $0.41 | $0.45 | $0.39 | $0.58 | $1.83 | 0.5% |
| 2017 | $0.43 | $0.52 | $0.43 | $0.55 | $1.92 | 4.9% |
| 2018 | $0.40 | $0.57 | $0.50 | $0.58 | $2.04 | 6.3% |
| 2019 | $0.51 | $0.47 | $0.55 | $0.60 | $2.13 | 4.4% |
| 2020 | $0.47 | $0.60 | $0.56 | $0.66 | $2.30 | 8.0% |
| 2021 | $0.51 | $0.68 | $0.70 | $0.77 | $2.66 | 15.7% |
| 2022 | $0.69 | $0.69 | $0.72 | $0.87 | $2.97 | 11.7% |
| 2023 | $0.75 | $0.77 | $1.52 |
まとめ


・VIGにAAPLが追加された
・VIGのなかでAAPLとMSFTの影響力が拡大
・今後の配当・株価に注目してきましょう
サラリーマン投資家ぐりっとの目線


VIGは9株のみ保有。円換算ではプラス推移しているが、ドル換算ではマイナス推移。
今後も継続して保有してく。
追加も検討中。


コメント